Test a horizon profile scenario
Scenario mode assesses the effect of changing the horizon profile without altering the original survey. Use it to estimate the benefit of clearing vegetation, reducing an obstacle’s height or testing another horizon configuration.
The simulation relies on assumptions. It does not replace site measurements.
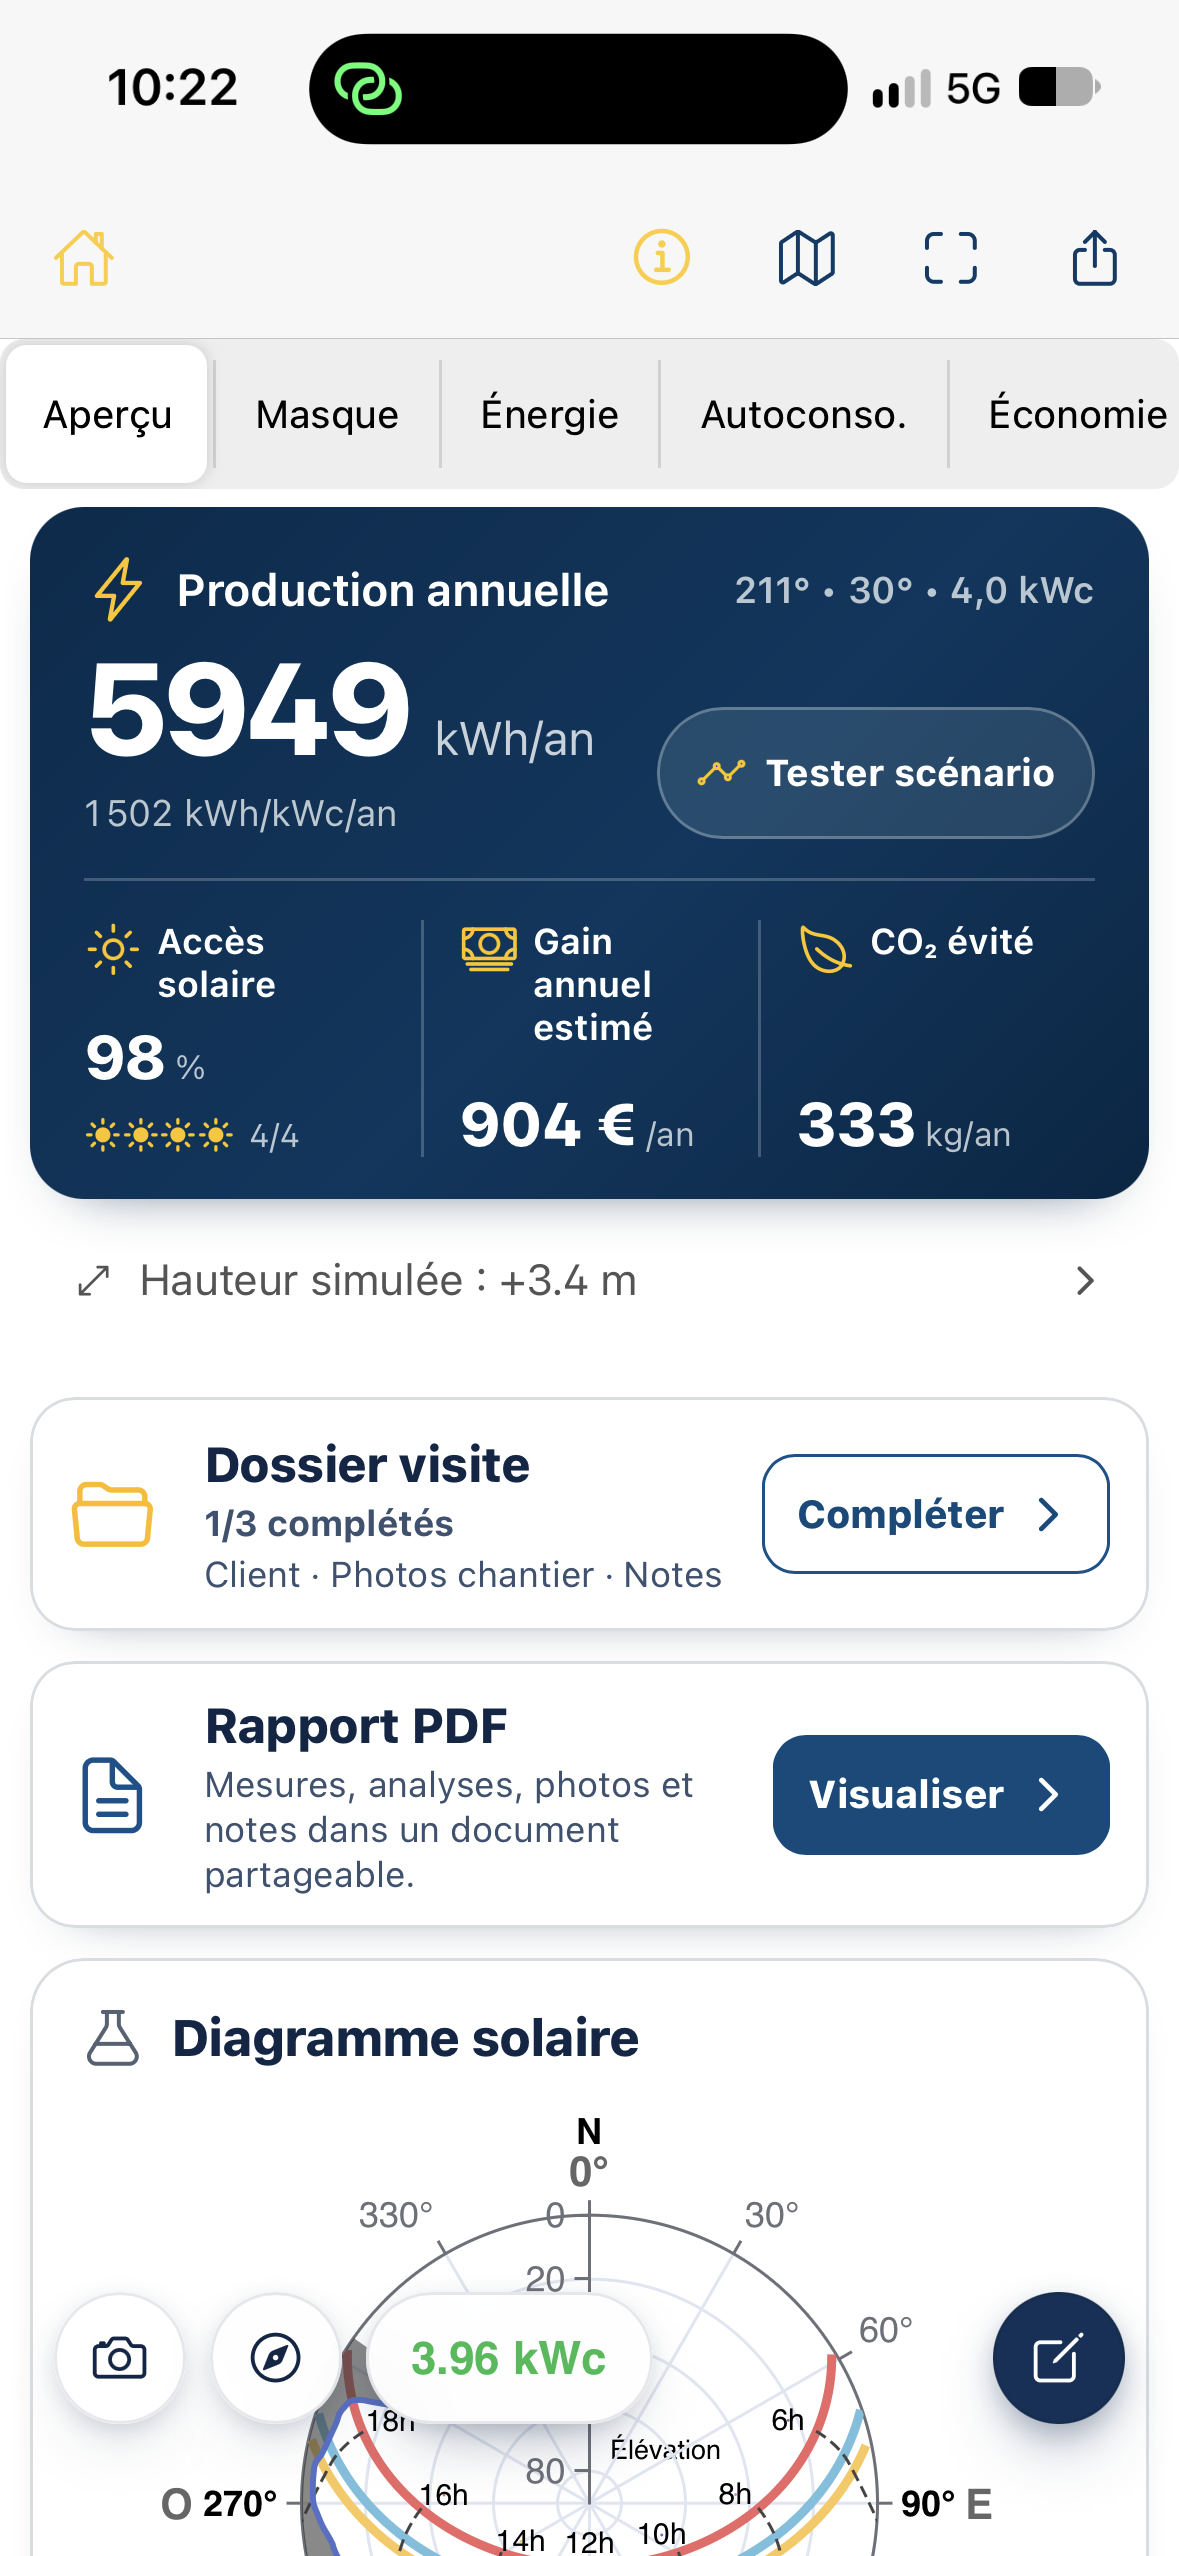
Open Scenario mode
Section titled “Open Scenario mode”- Open a project with an available survey and analyses.
- In Overview, tap Test scenario in the Annual production card.
- The horizon chart opens with sun paths and project results.
Initially, the scenario uses the measured profile, so differences from the current project are zero. After an edit, indicators recalculate to compare both situations.
Read the chart
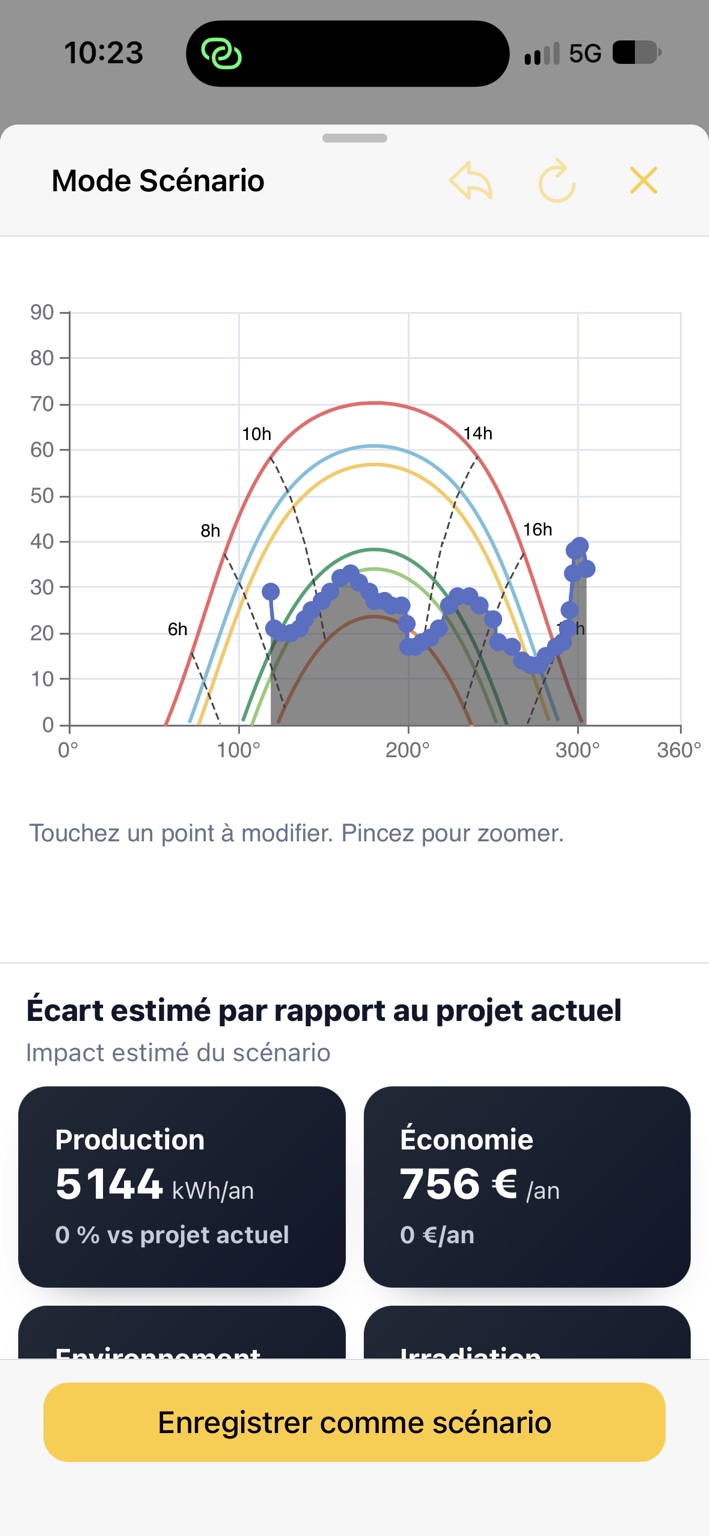
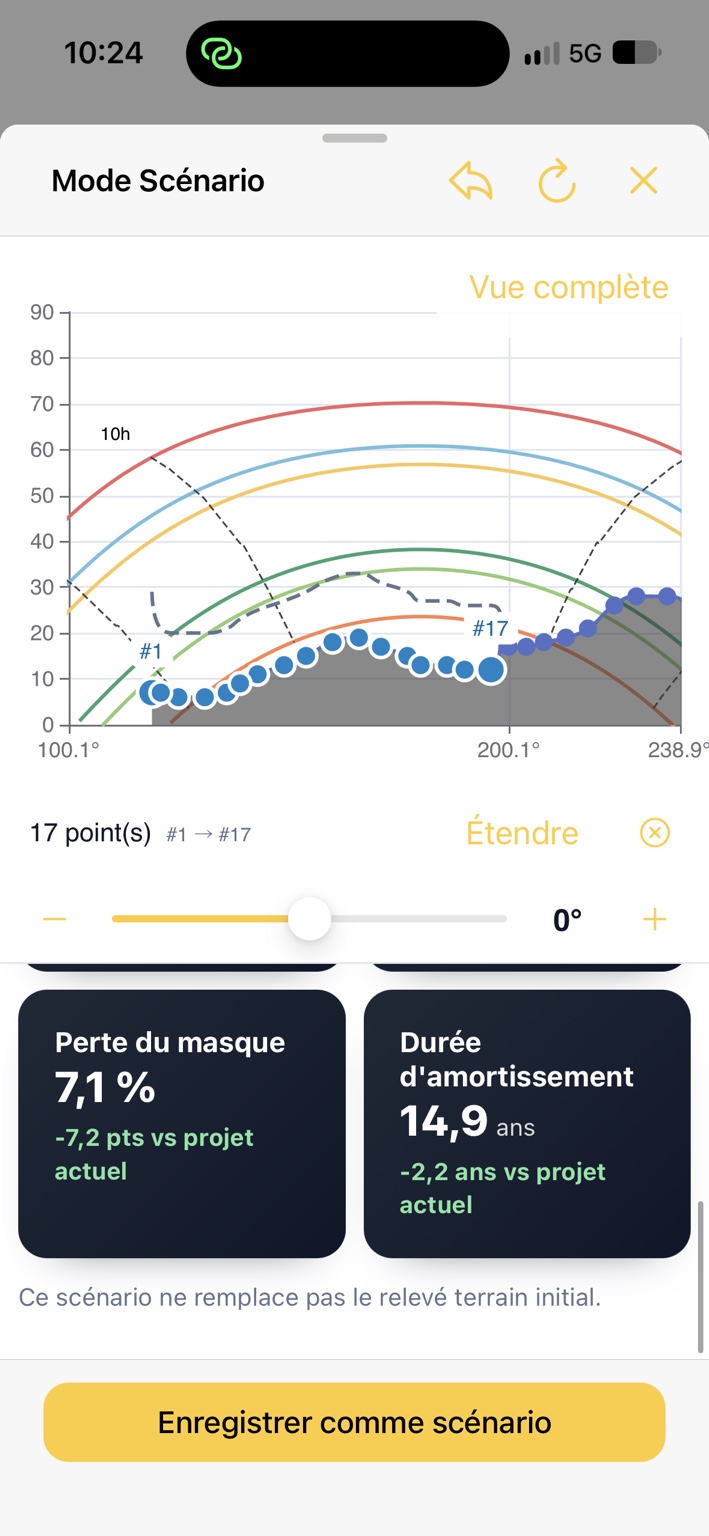
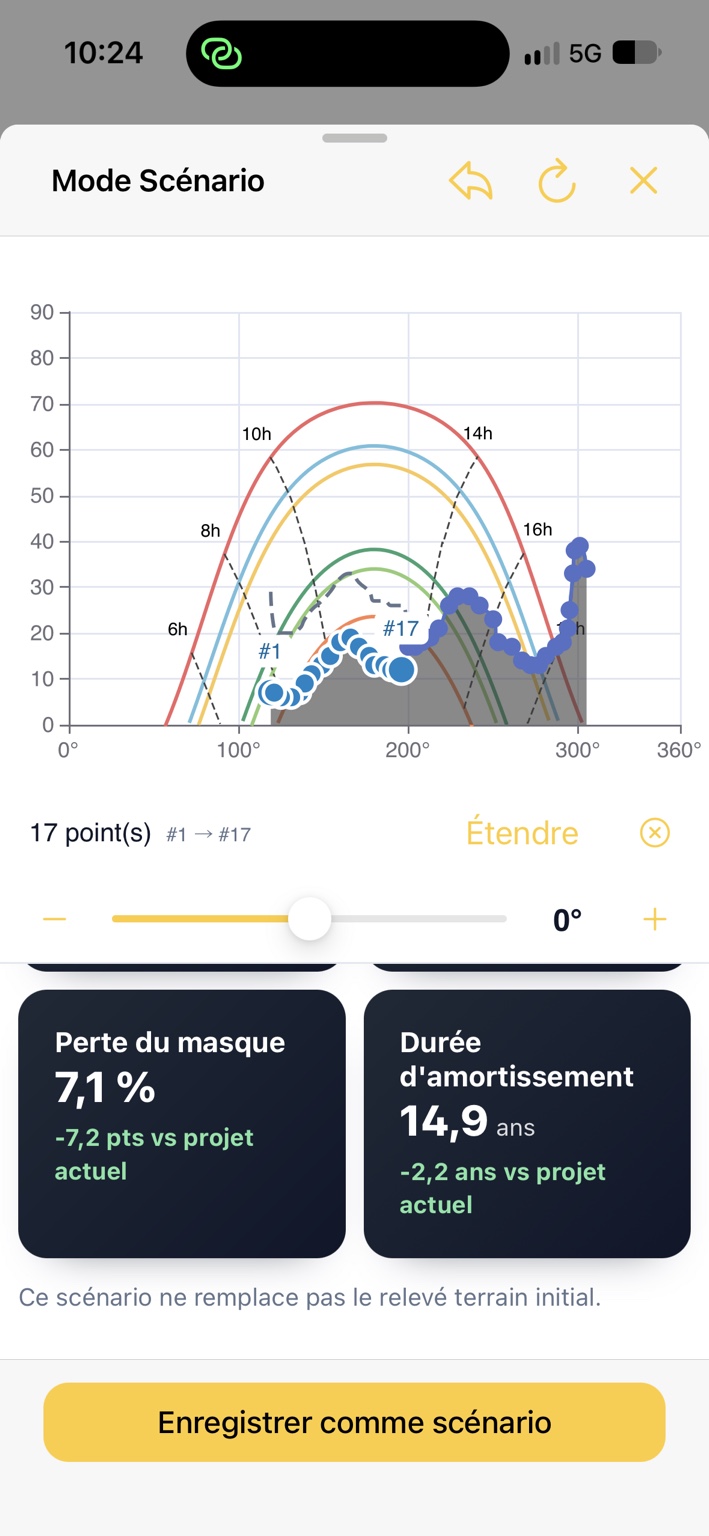
Section titled “Read the chart”The horizontal axis shows azimuth and the vertical axis elevation, in degrees. Colored curves show sun paths at different times of year.
The original profile remains visible as a reference. Blue points let you view and edit the scenario profile. Differences between the profiles identify the sector you changed.
To inspect an area, pinch to zoom, then pan the chart. Tap Full view to return to the overall view. This does not undo scenario changes.
Edit a point
Section titled “Edit a point”- Tap the blue point to edit.
- Its number appears and elevation controls become available.
- Use the slider or − / + buttons to lower or raise elevation. The displayed adjustment is an offset in degrees from the current value.
- The scenario profile updates and results recalculate after applying the change.
For example, −5° lowers the selected point’s elevation by five degrees, within the 0° horizon and 90° limits.
Edit part of the profile
Section titled “Edit part of the profile”To simulate clearing several consecutive points:
-
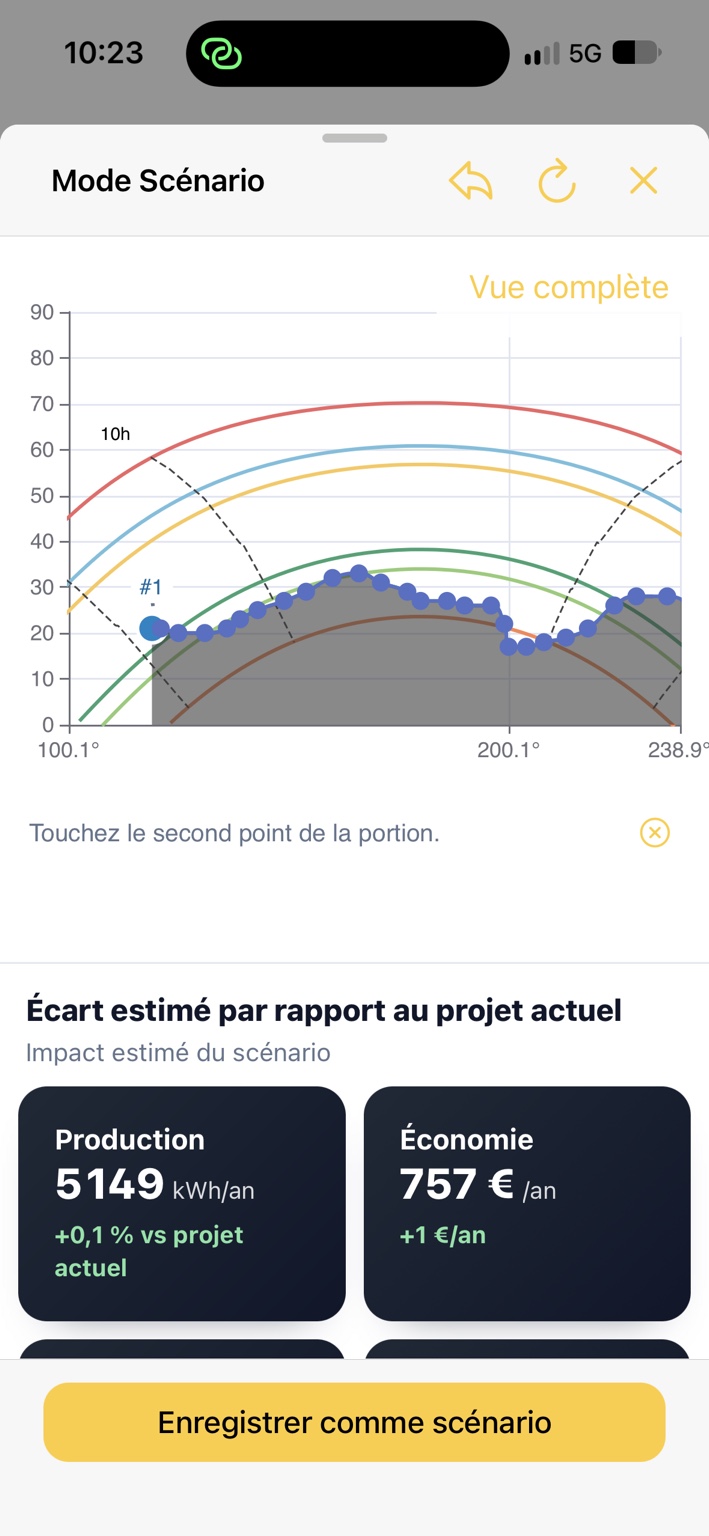
Tap the first point of the section.
-
Tap Extend.
-
When prompted to tap the second point of the section, select the other endpoint on the chart.
-
Azimutis selects all points between the endpoints in survey order.
-
Adjust elevation using the slider or − / + buttons. The offset applies to every selected point.
The line below the chart shows the selection range, for example 17 point(s), #1 → #17. Use × beside it to clear the selection.
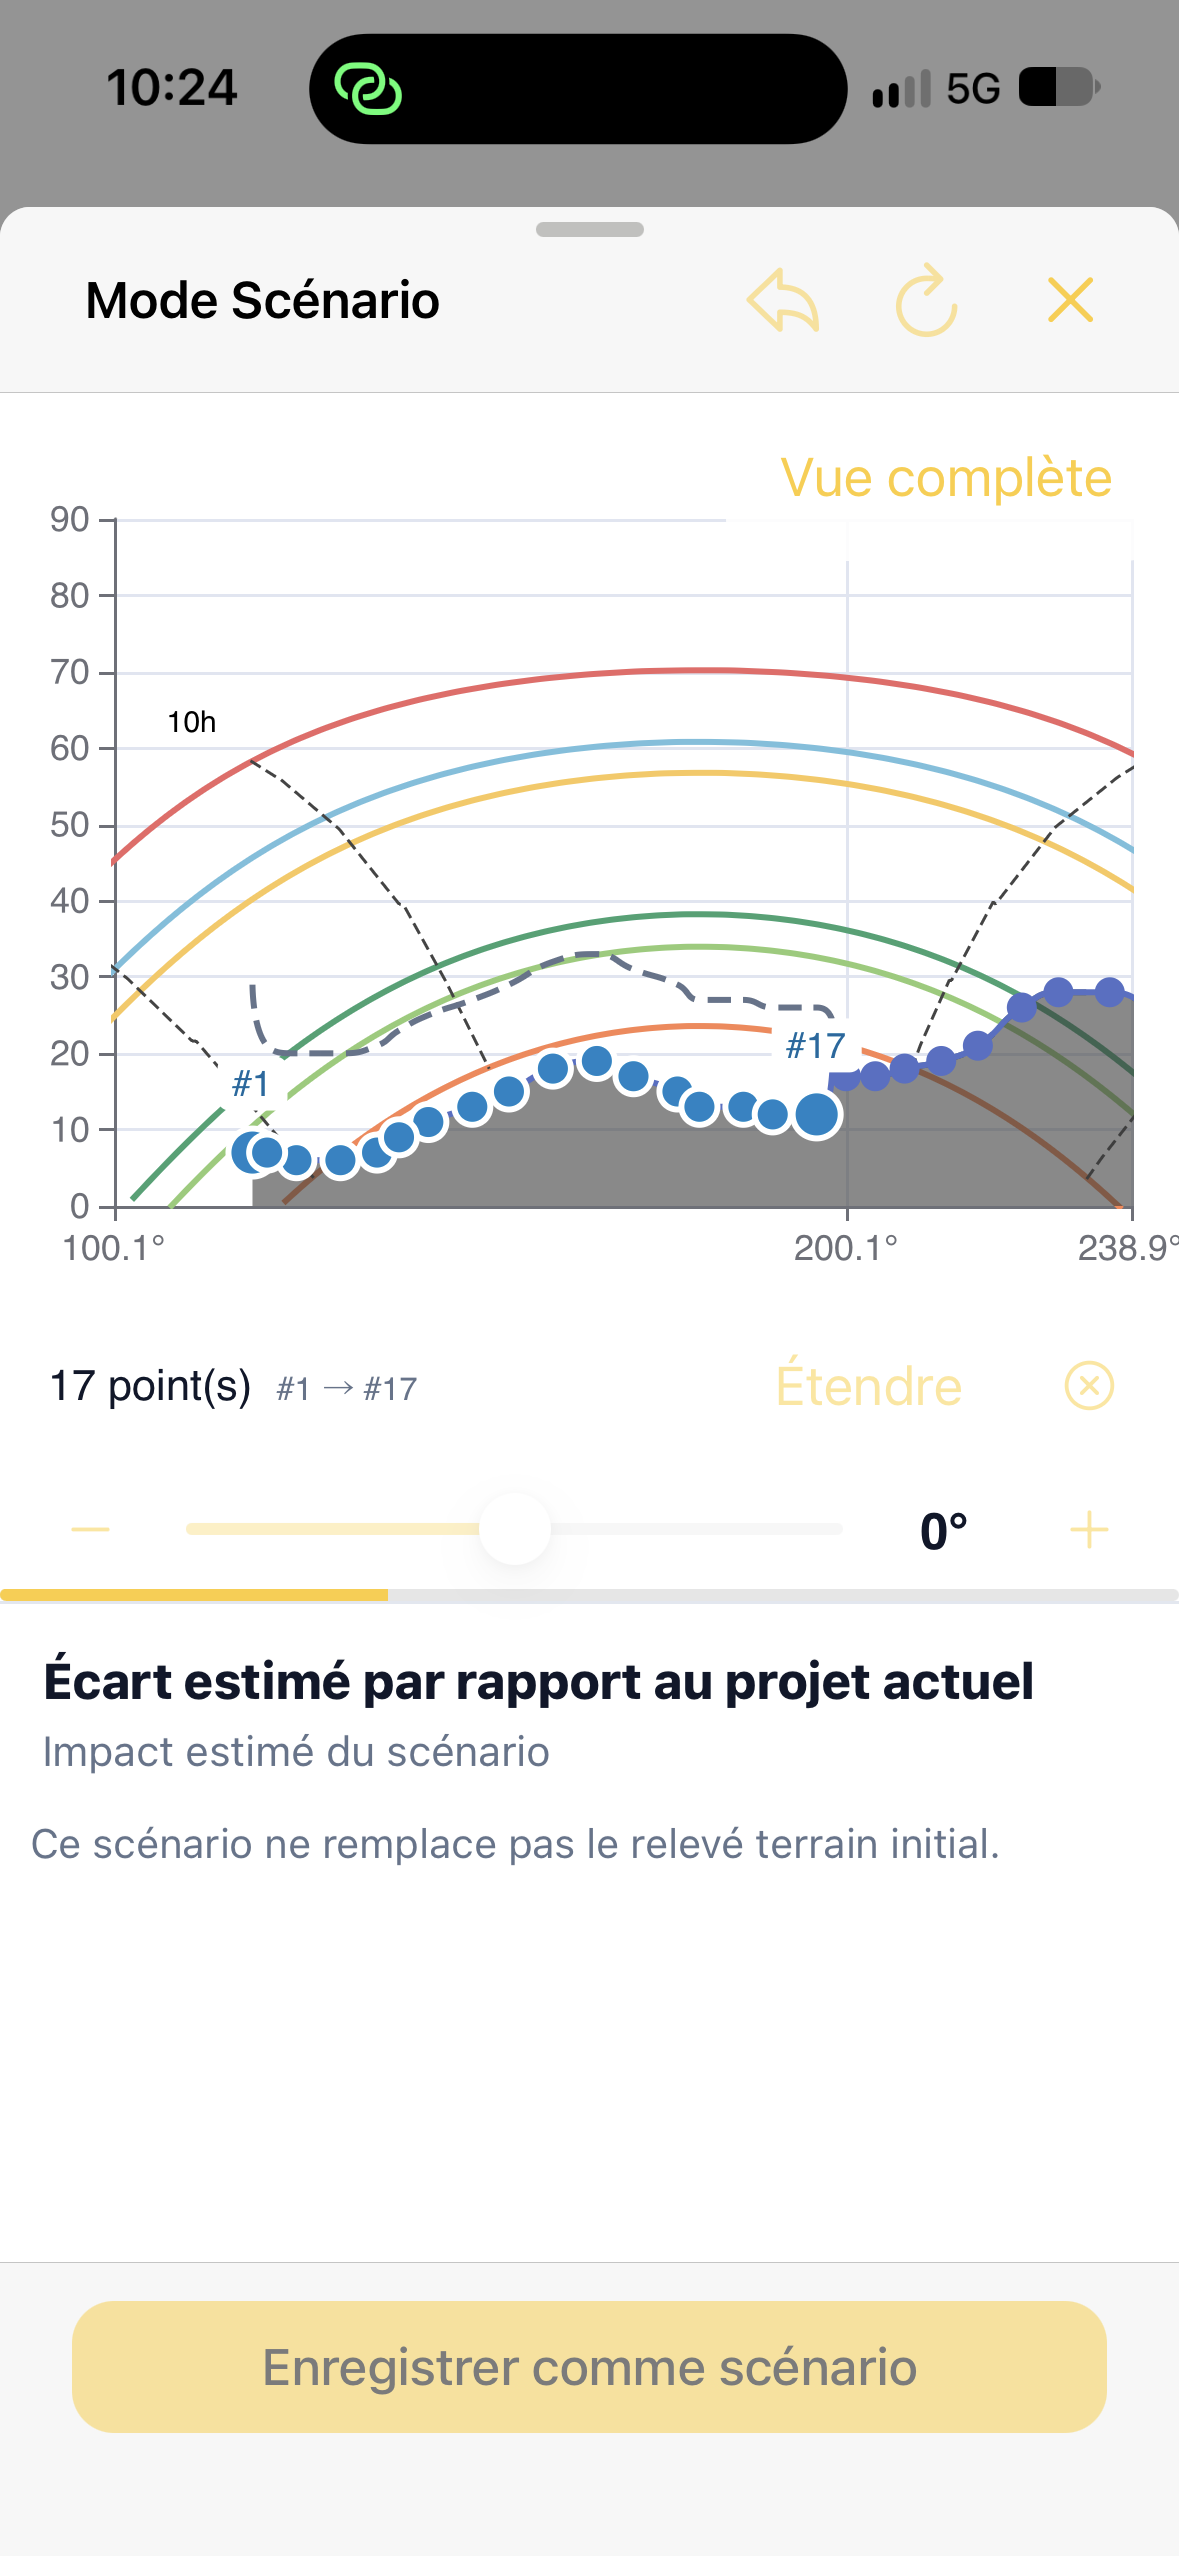
Zoom helps select closely spaced points. Return to Full view after adjusting.
Undo a change or restore the original profile
Section titled “Undo a change or restore the original profile”Controls at the top manage adjustments:
- Back arrow: undo the latest scenario change.
- Circular arrow: reset the scenario to the original profile.
- Cross: close Scenario mode.
Resetting the scenario is different from Full view, which only changes chart zoom.
Understand the comparison
Section titled “Understand the comparison”Below the chart, Estimated difference from the current project presents recalculated results. Depending on available data, these include:
| Indicator | Interpretation |
|---|---|
| Production | Estimated annual scenario production in kWh/year and its difference from the current project. |
| Economy | Estimated annual savings and difference from the current project. |
| Environment | Environmental indicators recalculated from production. |
| Irradiation | Estimated solar energy after applying the new profile. |
| Shading losses | Share of the solar resource lost because of scenario obstacles. |
| Payback period | Estimated project financial payback under the scenario. |
Differences appear as absolute values, percentages or percentage points, depending on the indicator. For example, −7.2 pts for shading losses means a reduction of 7.2 percentage points; −2.2 years for payback means estimated financial payback is 2.2 years shorter.
Cards may temporarily disappear or be unavailable during recalculation. Wait until calculation finishes before comparing. An unavailable analysis is not a zero difference.
Save as a separate project
Section titled “Save as a separate project”- Finish profile adjustments and wait for recalculated results.
- Tap Save as scenario.
- Azimutis creates a new project from the current assessment, retaining the edited profile and associated assumptions.
The new project receives a variant name such as Project name — Scenario 1, with subsequent numbers for further variants. The original project and survey are preserved.
Saving depends on account permissions and the ability to create a project. In read-only mode, you can view the scenario without saving a variant.
Scenario mode and simulated height serve different purposes
Section titled “Scenario mode and simulated height serve different purposes”Scenario mode changes the assumed angular height of one or more horizon obstacles. For example, it can estimate the effect of pruning a tree.
Simulate a different height estimates the horizon profile from a higher measurement position using obstacle distances. It answers a different question: what would solar exposure be at roof level?
See Simulate another height and Read and edit the horizon profile.
This scenario does not replace the original site survey.
Projects with several planes
Section titled “Projects with several planes”In a multi-plane project, select the plane before editing its sizing, orientation, layout or height. Editing a shared survey affects every plane using it. Consumption, battery and economic assumptions remain common to the installation.