Understand the economic analysis
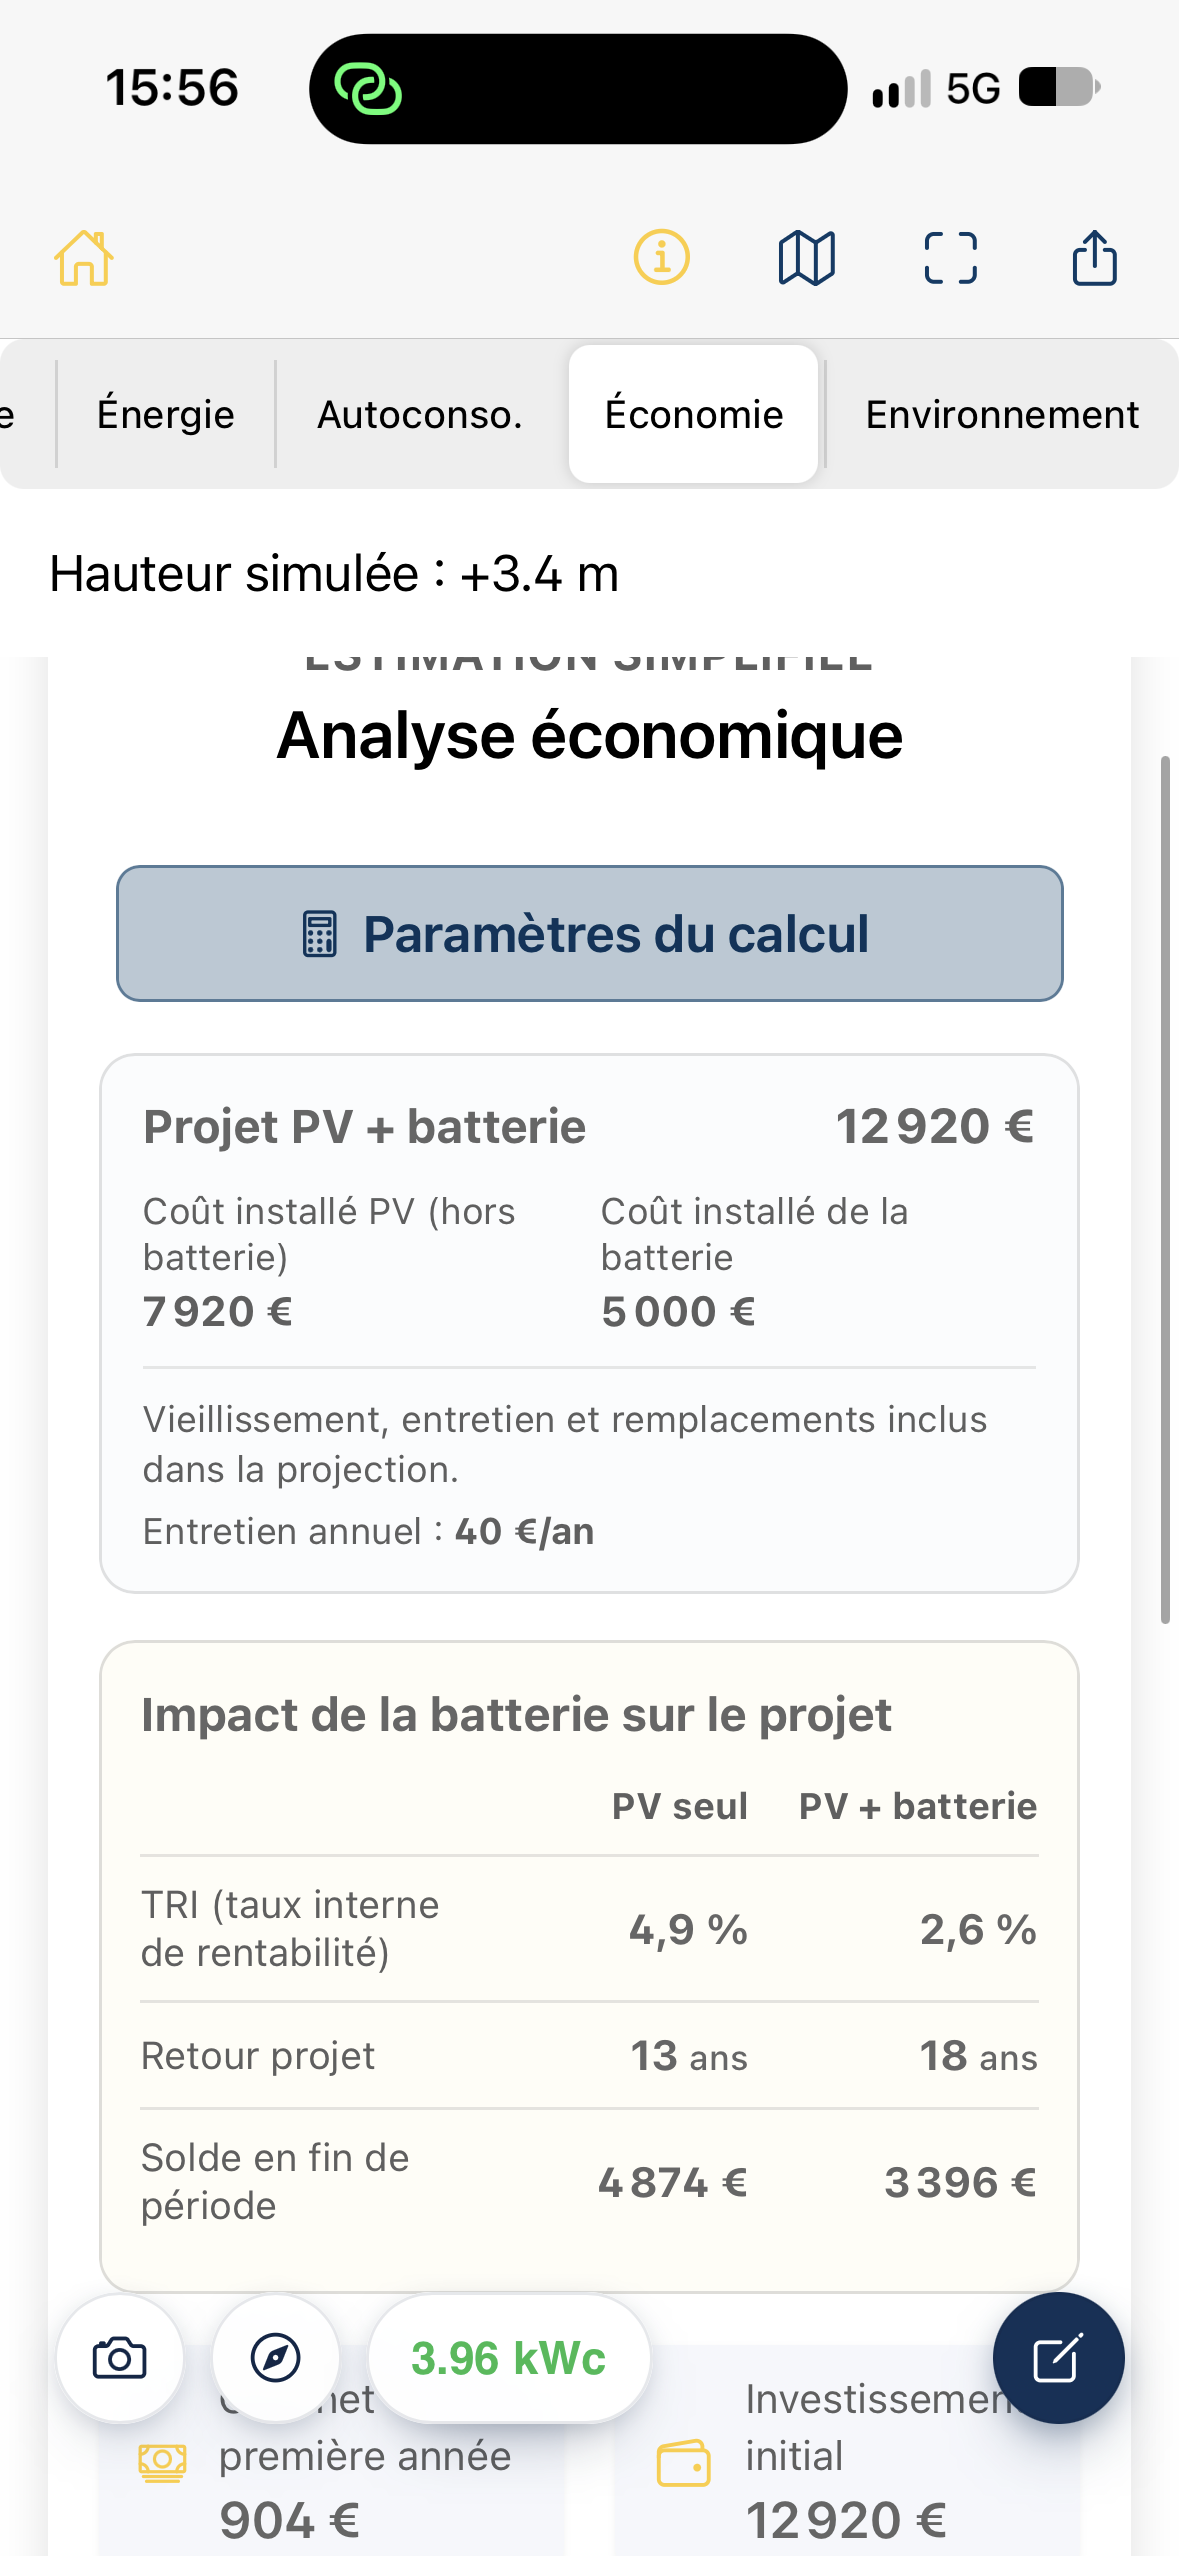
The Economy tab presents a financial projection for the PV system based on the project’s assumptions. When the scenario includes a battery, it compares PV only with PV + battery.
Open the analysis and settings
Section titled “Open the analysis and settings”- In the project results, tap Economy.
- Use Calculation parameters to open the economic assumptions directly if you want to review or change them.
- Scroll through the summary, indicators and available charts.
Understand the project investment
Section titled “Understand the project investment”The summary shows the cost of the project being assessed. For PV + battery, it distinguishes:
- the installed PV cost, excluding the battery;
- the installed battery cost;
- the total amount used in the projection.
The amount may come from a calculated assumption or a value entered in the settings. Compare it with an actual quotation before drawing economic conclusions.
The economic projection uses annual cash flows calculated by Azimutis, accounting for PV degradation, battery capacity loss, maintenance and replacements. Their costs and timing depend on the selected settings.
Read “Battery impact on the project”
Section titled “Read “Battery impact on the project””Where available, this table compares PV only and PV + battery side by side.
| Indicator | Meaning |
|---|---|
| IRR (internal rate of return) | Rate calculated from projected cash flows. It helps assess the scenario’s profitability under the selected assumptions. |
| Project payback | First year in which the cumulative balance becomes positive and remains at least zero through the end of the projection. A later replacement can therefore delay this point. |
| End-of-period balance | Cumulative financial balance at the end of the configured projection period. |
In the screenshot example, IRR is 4.9% for PV only and 2.6% with a battery. Project payback increases from 13 to 18 years, and the final balance falls from €4,874 to €3,396. This illustrates an important distinction: a battery can improve self-consumption while reducing estimated financial profitability.
These figures do not establish whether a battery is suitable for another project.
Understand the other indicators
Section titled “Understand the other indicators”Further down the tab, depending on the model and available results, you may find:
- estimated savings for the first year or stated period;
- initial investment, in the selected currency;
- simple payback or the displayed payback period;
- annual production, in kWh/year;
- estimated cost per kWh, cumulative savings and IRR;
- a chart of cumulative cash flows over time.
Distinguish simple payback, calculated from investment and estimated first-year net savings, from project payback, based on annual cumulative savings, surplus sales, maintenance and replacements. They can produce different periods.
IRR is calculated from a cash flow series: a negative initial investment followed by annual net cash flows. Average cost per kWh divides investment plus cumulative operating and replacement costs by cumulative PV production; this calculation does not discount costs.
When the installed battery cost is missing, Azimutis does not present a complete financial assessment for PV + battery. Energy results may still be available.
Check the calculation assumptions
Section titled “Check the calculation assumptions”Under Calculation parameters / Economy, check:
- Installed PV cost and, where applicable, battery cost.
- The projection period.
- The electricity purchase price and surplus export tariff.
- Electricity price changes and degradation, maintenance and replacement assumptions.
Change the required values and tap Apply to update the results.
Points to check
Section titled “Points to check”- Economic results are estimates, sensitive to energy prices, consumption, initial investment and projection period.
- A higher IRR does not automatically mean a higher final gain: these are different indicators.
- Automatic battery sizing selects an estimated energy compromise, not necessarily the most profitable option.
- Do not confuse the benefit of the battery alone with the profitability of the PV project including a battery.