Understand the Overview tab
Overview is the first results tab. It brings together key project indicators and shortcuts for further assessment. It does not replace the dedicated Horizon profile, Energy, Self-cons., Economy or Environment tabs.
Understand the summary card
Section titled “Understand the summary card”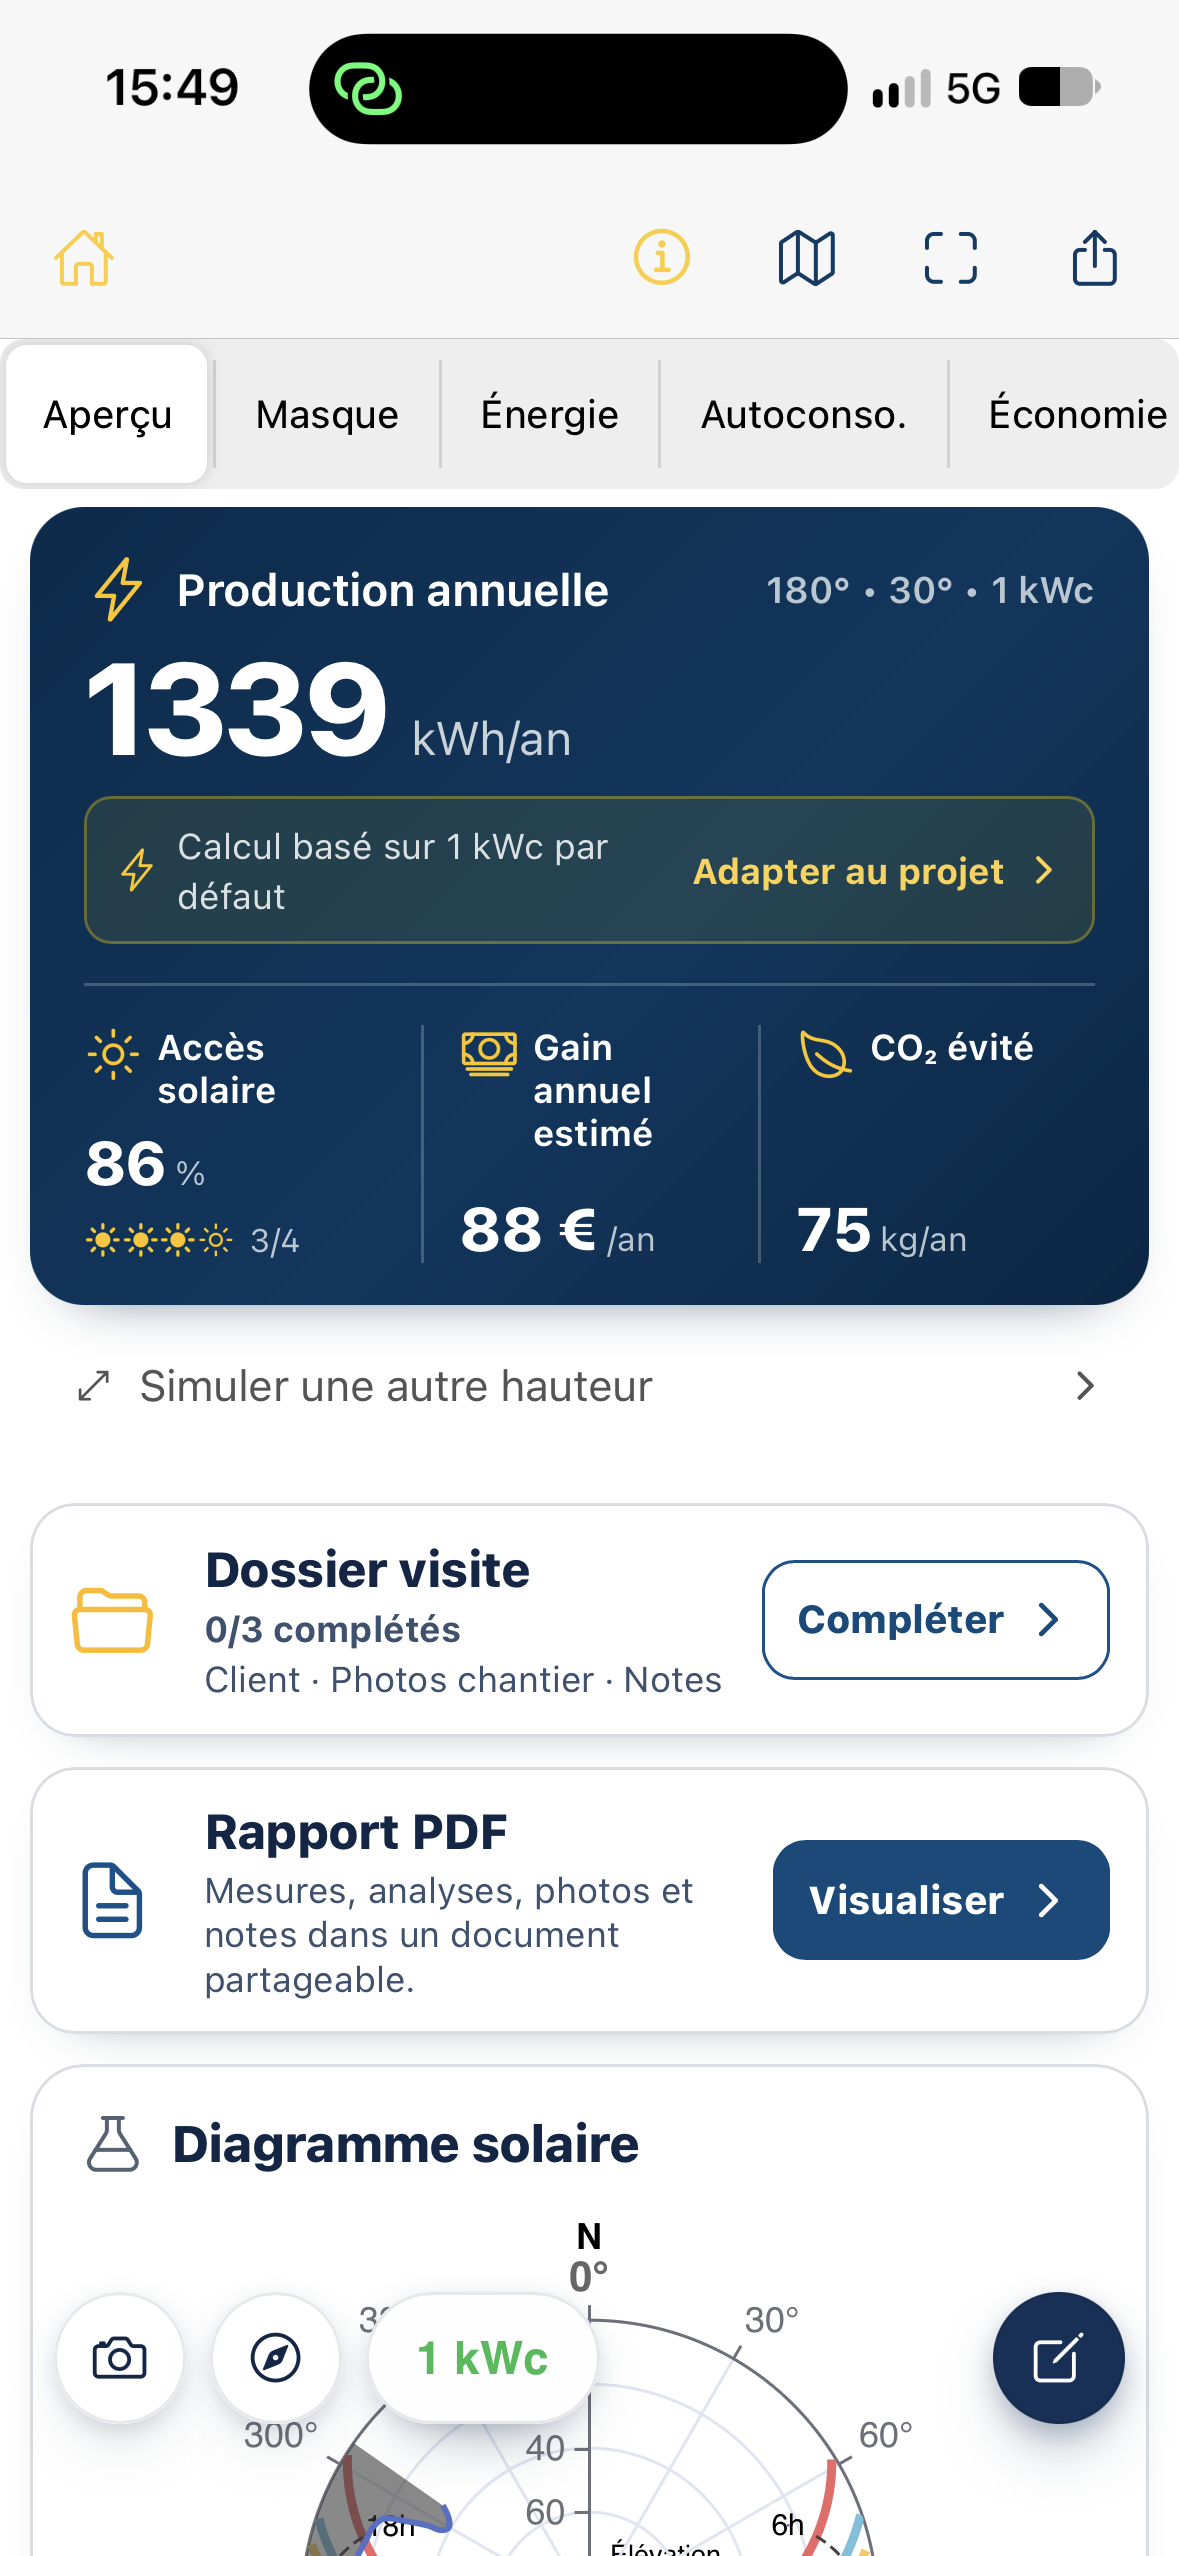
Depending on the settings and analysis access, the main card shows:
| Item | Meaning |
|---|---|
| Annual production (kWh/year) | Estimated electricity production under the assessment assumptions. |
| Orientation, tilt, capacity | Reminder of selected calculation assumptions, for example 180°, 30°, 1 kWp. |
| Solar access (%) | Annual share of global irradiation remaining after accounting for the modeled horizon profile. |
| Estimated annual savings (€/year or another currency) | Indicator based on production and the assessment’s economic assumptions. |
| Avoided CO₂ emissions (kg/year) | Environmental estimate for the scenario using the selected calculation factors. |
These values are not measurements of actual production. Tap an indicator when it is shown as a link to open its results section.
Why does the app show 1 kWp?
Section titled “Why does the app show 1 kWp?”A new example assessment may use 1 kWp by default, without assuming the actual installable capacity. In this case, a Calculation based on 1 kWp by default notice and an Adapt to project action appear.
- Tap Adapt to project.
- Under PV sizing, choose roof measurement or manual entry.
- Also check the surface orientation and tilt.
- Tap Apply to run the analysis with your selected assumptions.
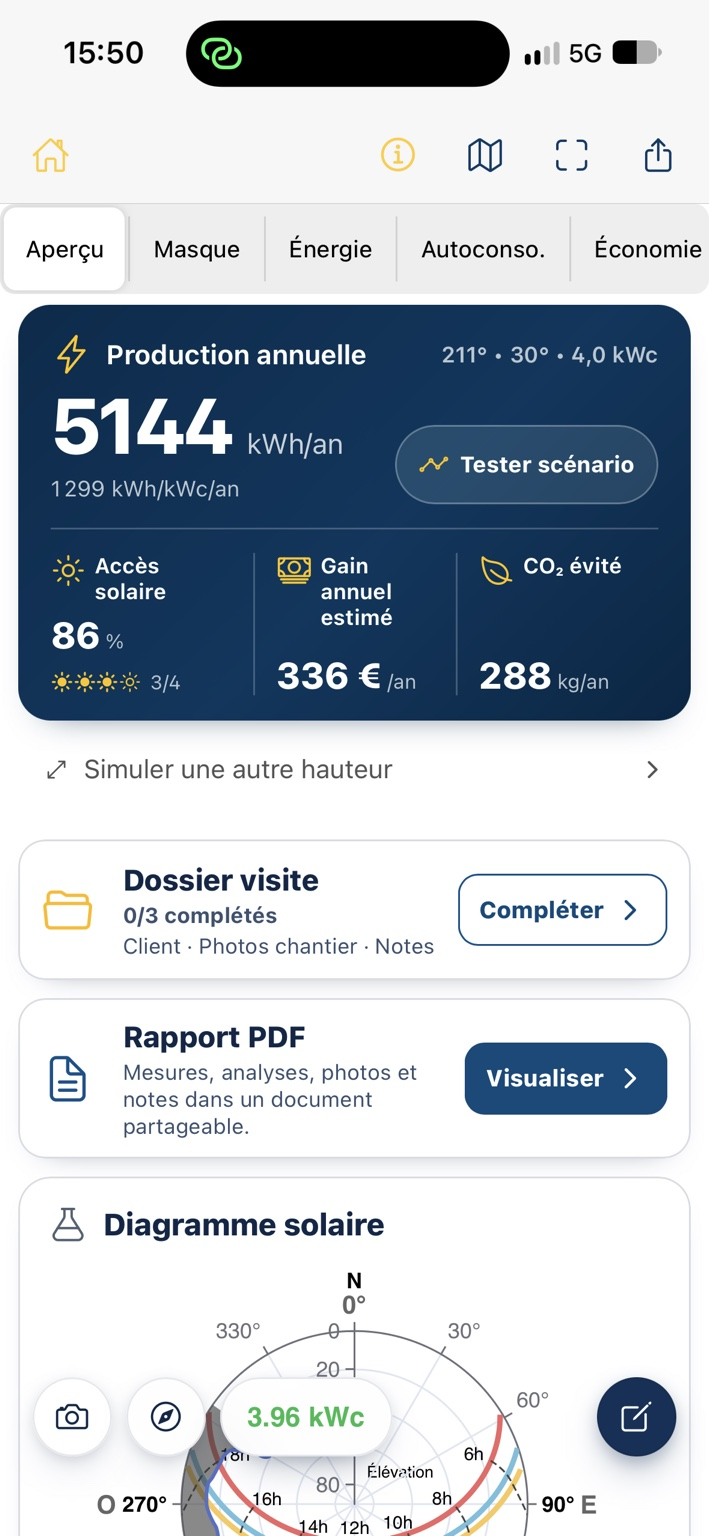
Once the project is configured, Test scenario may replace the prompt to adjust capacity. It lets you test a horizon profile change while keeping the scenario distinct from the original site survey.
Simulate another height
Section titled “Simulate another height”Simulate a different height estimates results at roof level from a survey taken lower down. This is a separate workflow from capacity configuration and uses obstacle distances to adjust the horizon profile for the new viewpoint.
See Simulate another survey height and Check obstacle distances.
Visit file and PDF report
Section titled “Visit file and PDF report”Below the summary, you will find:
- Visit file: customer information, site photos and notes. 0/3 completed refers to completed sections, not solar survey progress.
- PDF report: opens a preview of the document combining measurements, analyses and, where available, site visit information.
These sections enrich the report. They are not required to measure the horizon profile itself.
Sun path diagram
Section titled “Sun path diagram”The Sun path diagram shows the horizon profile and sun paths in a polar view. It helps you relate obstacles to the sun’s directions and elevations. Open Horizon profile to see captured points and their photos.
Navigation shortcuts
Section titled “Navigation shortcuts”The icons at the top of the results screen include access to home, project location, survey replacement, and sharing or downloading results. An action bar may also offer a photo, an orientation measurement, the selected capacity and general settings.