Understand energy and production results
The Energy tab shows the solar irradiation received by the project, the estimated effect of the horizon profile on that irradiation, and the corresponding PV production. Values depend on the location, horizon profile and system assumptions, including capacity, orientation and tilt.
Open the Energy tab
Section titled “Open the Energy tab”- Open an assessment with a saved survey or scenario.
- Tap Energy in the results bar. Scroll the bar horizontally if the tab is not visible.
- Scroll down the page to view the indicators and charts.
Results may be unavailable if the analyses require specific access or could not be calculated.
Read the summary indicators
Section titled “Read the summary indicators”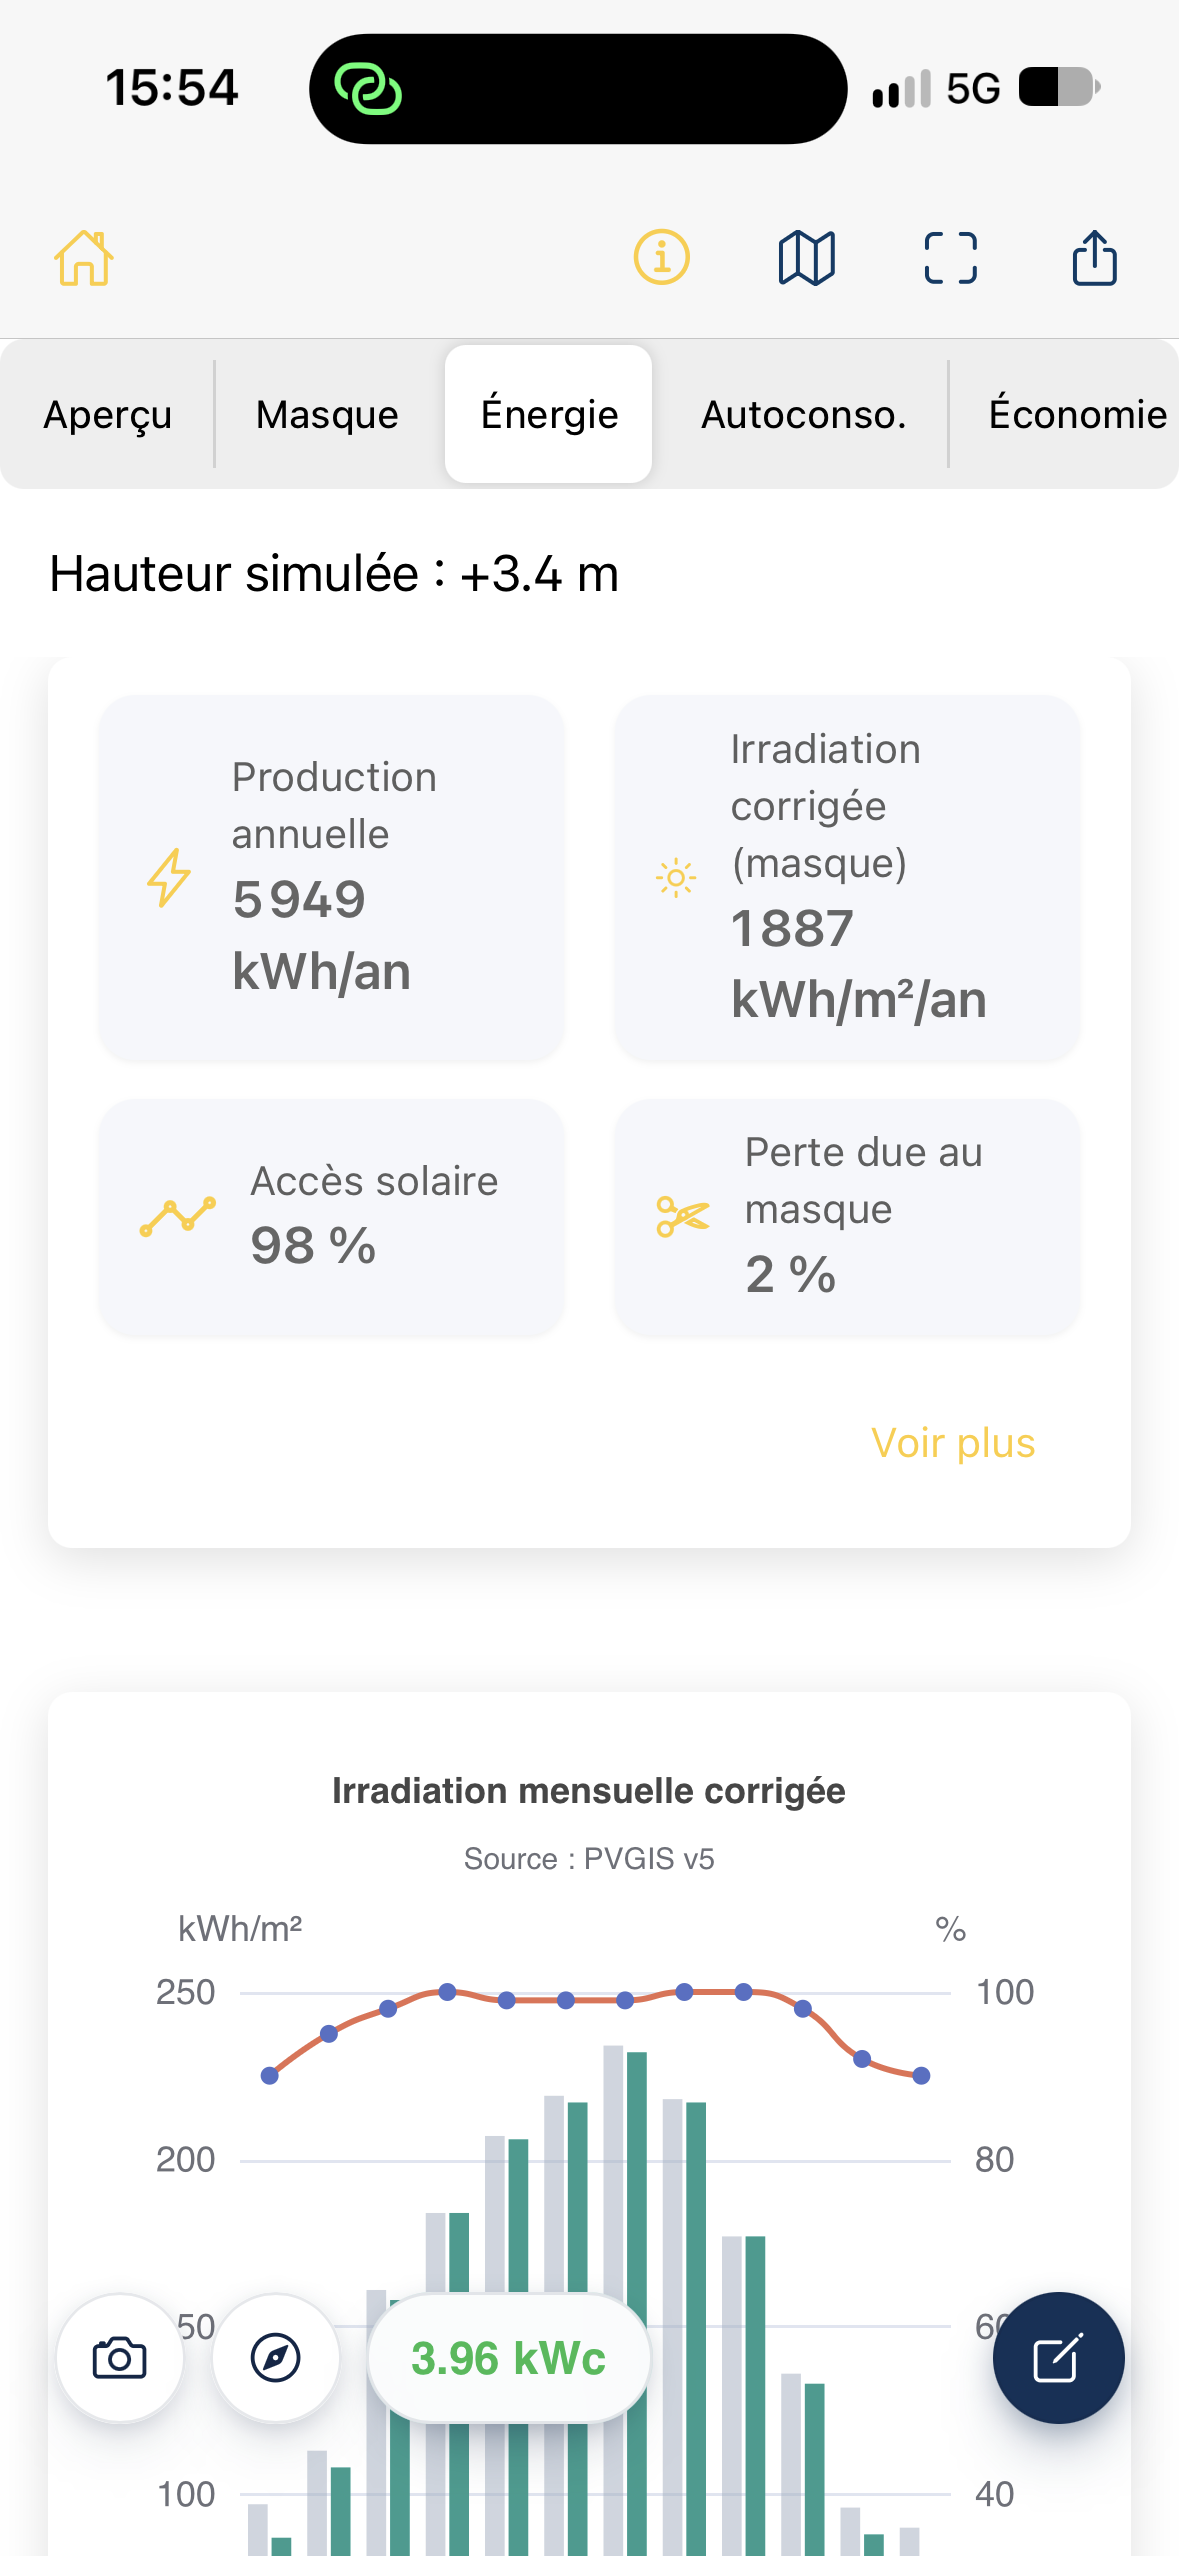
| Indicator | Meaning |
|---|---|
| Annual production (kWh/year) | Estimated electricity production from the PV system over one year. |
| Corrected irradiation (kWh/m²/year) | Solar energy received by the assessed surface after accounting for the horizon profile. This is not electricity production. |
| Solar access (%) | Share of the solar resource remaining after accounting for the horizon profile. |
| Shading losses (%) | Estimated reduction in the solar resource attributed to the horizon profile. |
Show more displays additional information, including specific yield in kWh/kWp/year and unshaded irradiation, where available.
Installed capacity in kWp is different from annual production in kWh/year.
Interpret the monthly irradiation chart
Section titled “Interpret the monthly irradiation chart”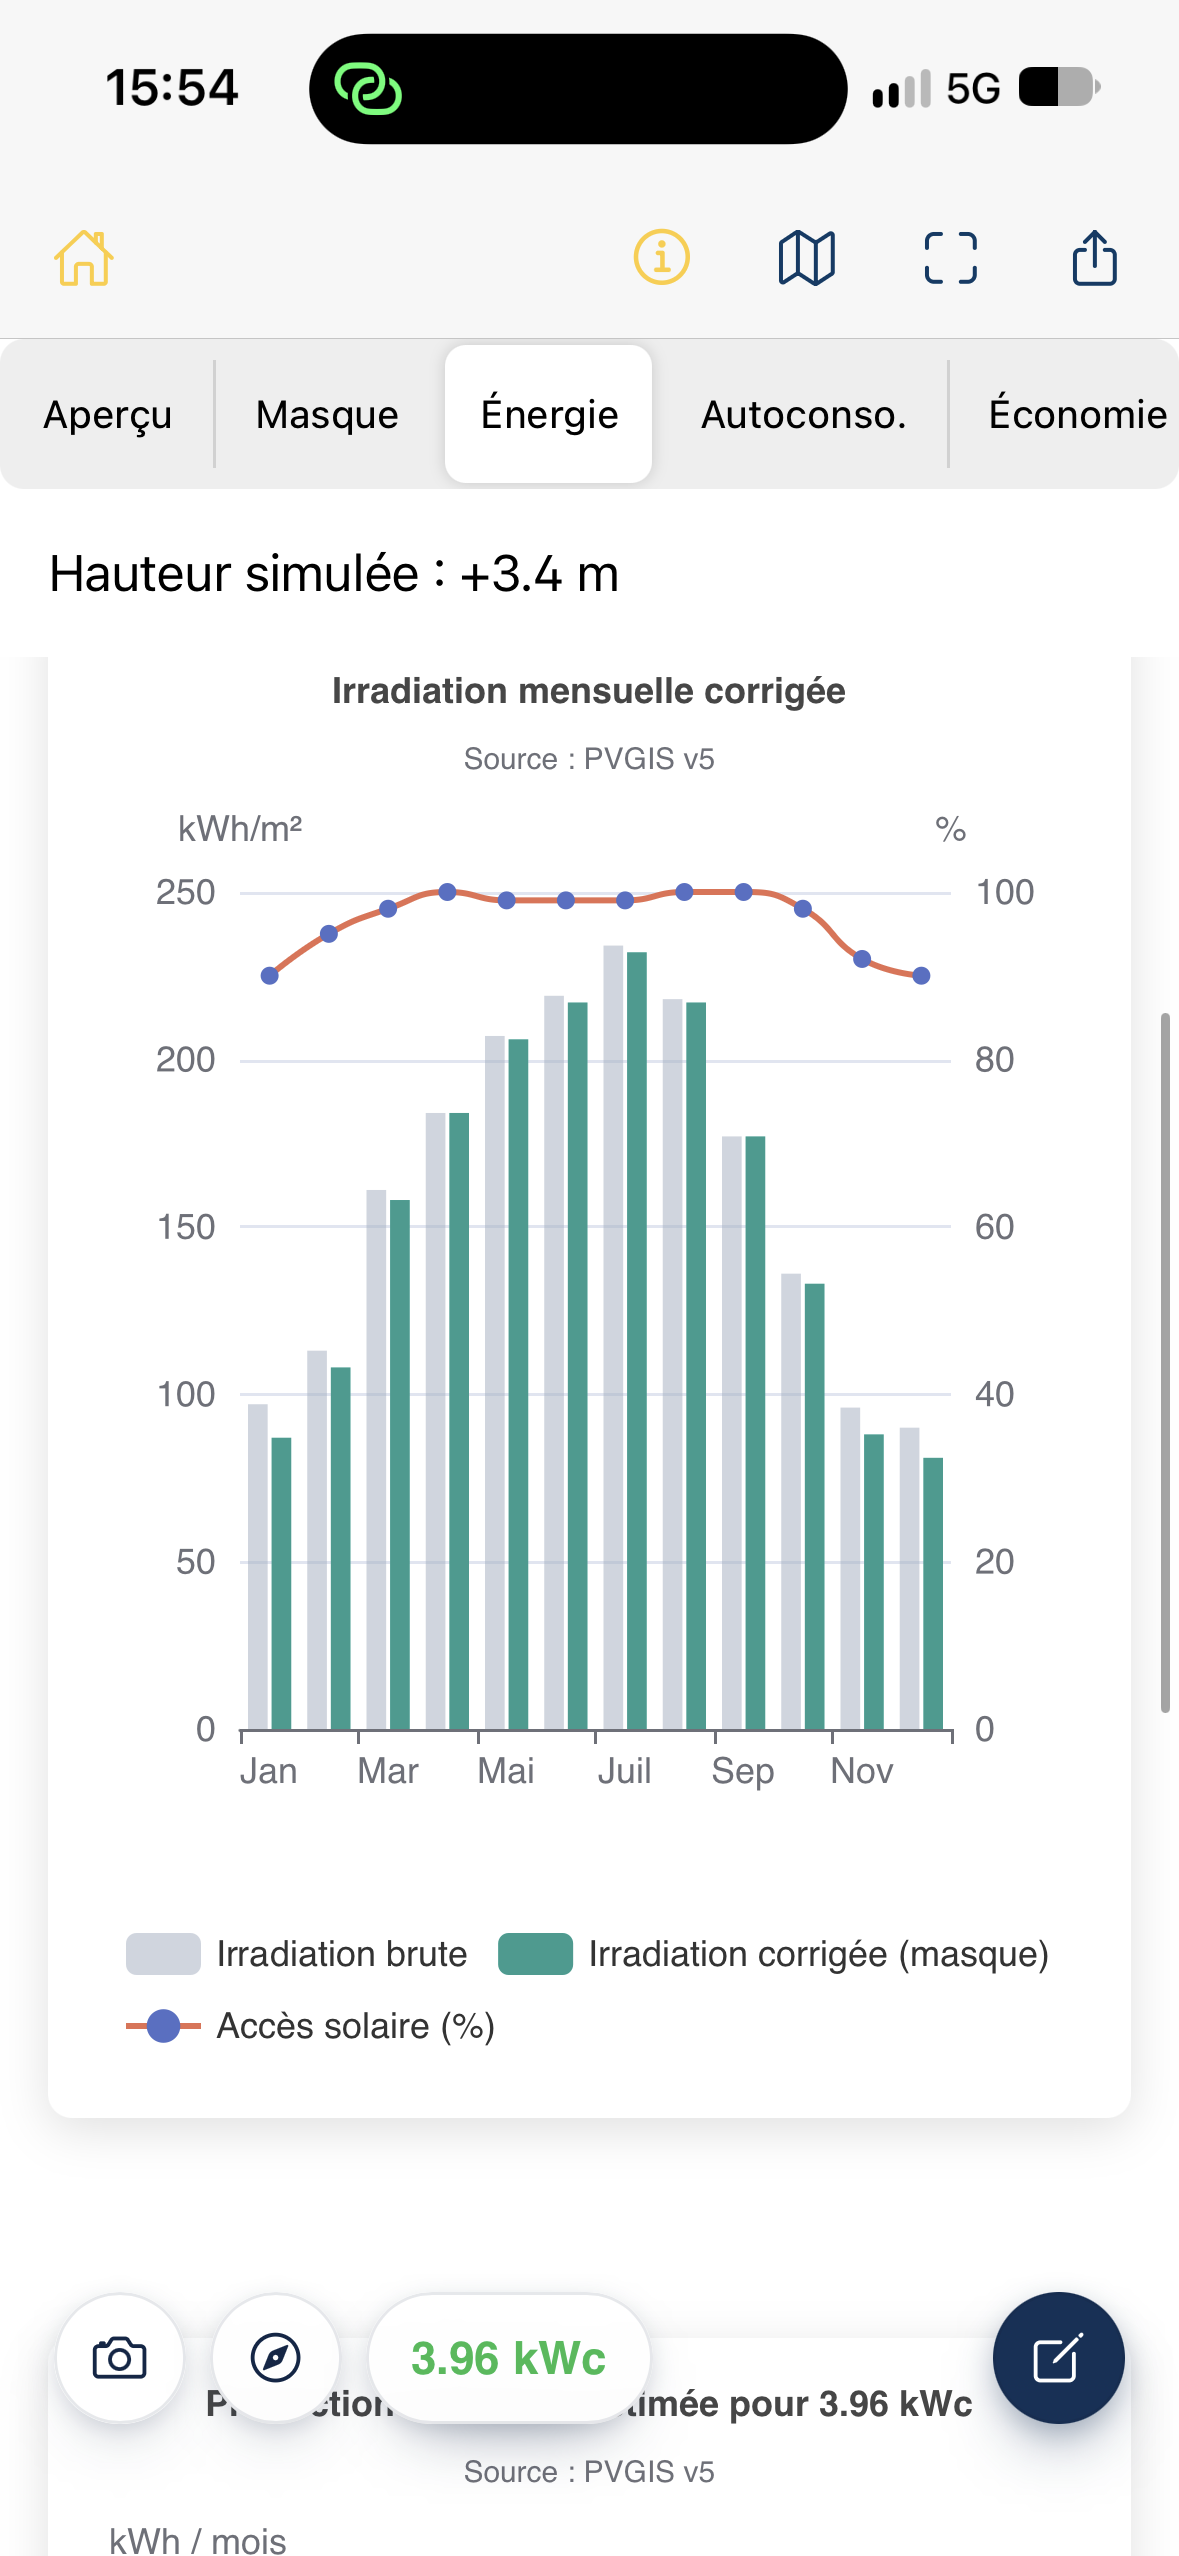
The Corrected monthly irradiation chart contains three elements:
- Raw irradiation, in gray: monthly irradiation on the surface before applying the assessed horizon profile.
- Corrected irradiation (shading), in green: estimated monthly irradiation accounting for shading.
- Solar access (%), shown as a line with points: share of the solar resource remaining each month.
Months run along the horizontal axis. The left vertical axis shows irradiation in kWh/m² and the right axis shows solar access in %. Do not compare the two scales directly.
How to read the chart: when the gray and green bars are close, the estimated shading effect is small for that month. A larger gap indicates greater losses. Results can vary considerably with the season and sun path.
Interpret monthly electricity production
Section titled “Interpret monthly electricity production”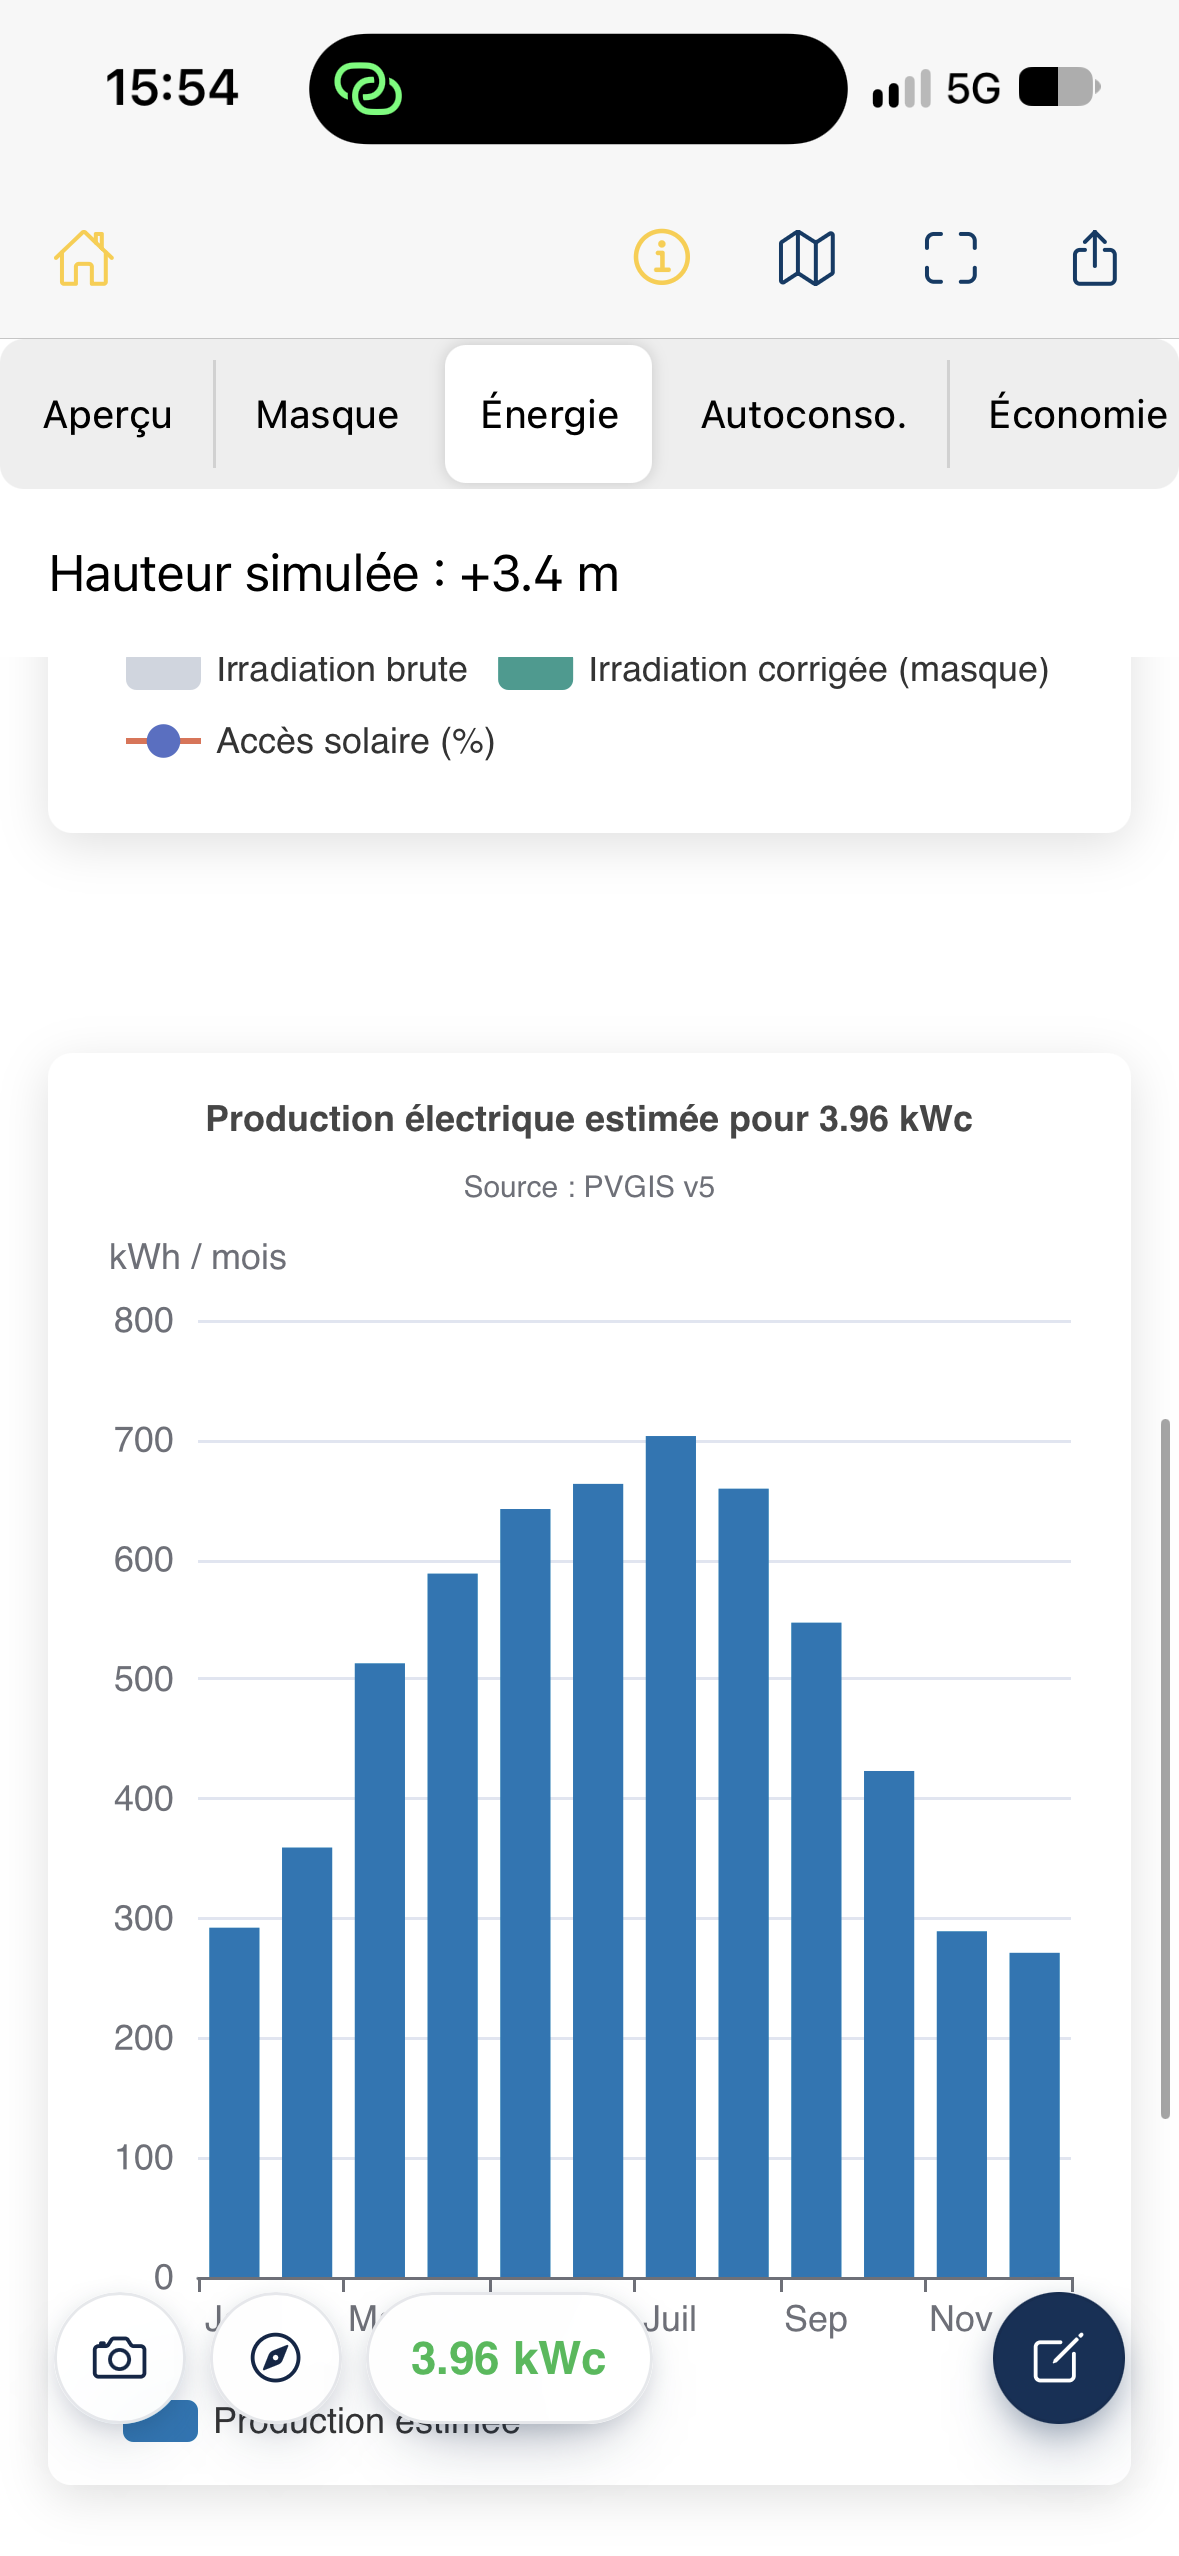
The Estimated electricity production chart shows estimated PV production for each month in kWh/month. It helps identify seasonal differences and compare the scale of production in the most and least productive months.
The PVGIS v5 label identifies the solar data source used for the displayed analysis. This is an estimate, not a measurement of actual production or a yield guarantee.
If height has been simulated
Section titled “If height has been simulated”When height simulation is active, a Simulated height: +… m banner appears above the results. The displayed charts and indicators correspond to the currently applied scenario. To review the height assumptions, see Simulate another survey height.
Points to check
Section titled “Points to check”- High irradiation does not automatically mean high production: capacity, equipment and calculation assumptions also matter.
- Solar access and shading losses describe the effect of the horizon profile in the analysis. They do not represent all technical system losses.
- Screenshot values illustrate one project and are not reference values.
Related articles
Section titled “Related articles”- Understand the results screen
- Configure the PV system
- Read and edit the horizon profile
- Simulate another survey height
Projects with several planes
Section titled “Projects with several planes”With multiple planes, distinguish individual results from the overall summary. Production is added; consumption, battery and economics are calculated for one installation. The report identifies planes and surveys without unnecessarily repeating identical profiles or shared photos. Horizon exports are grouped by plane; portal hourly exports distinguish the summary from plane-specific data.