Understand self-consumption results
The Self-cons. tab shows the estimated distribution of PV production and site consumption. If a battery is enabled, it also shows results without a battery for comparison.
Read “Project situation”
Section titled “Read “Project situation””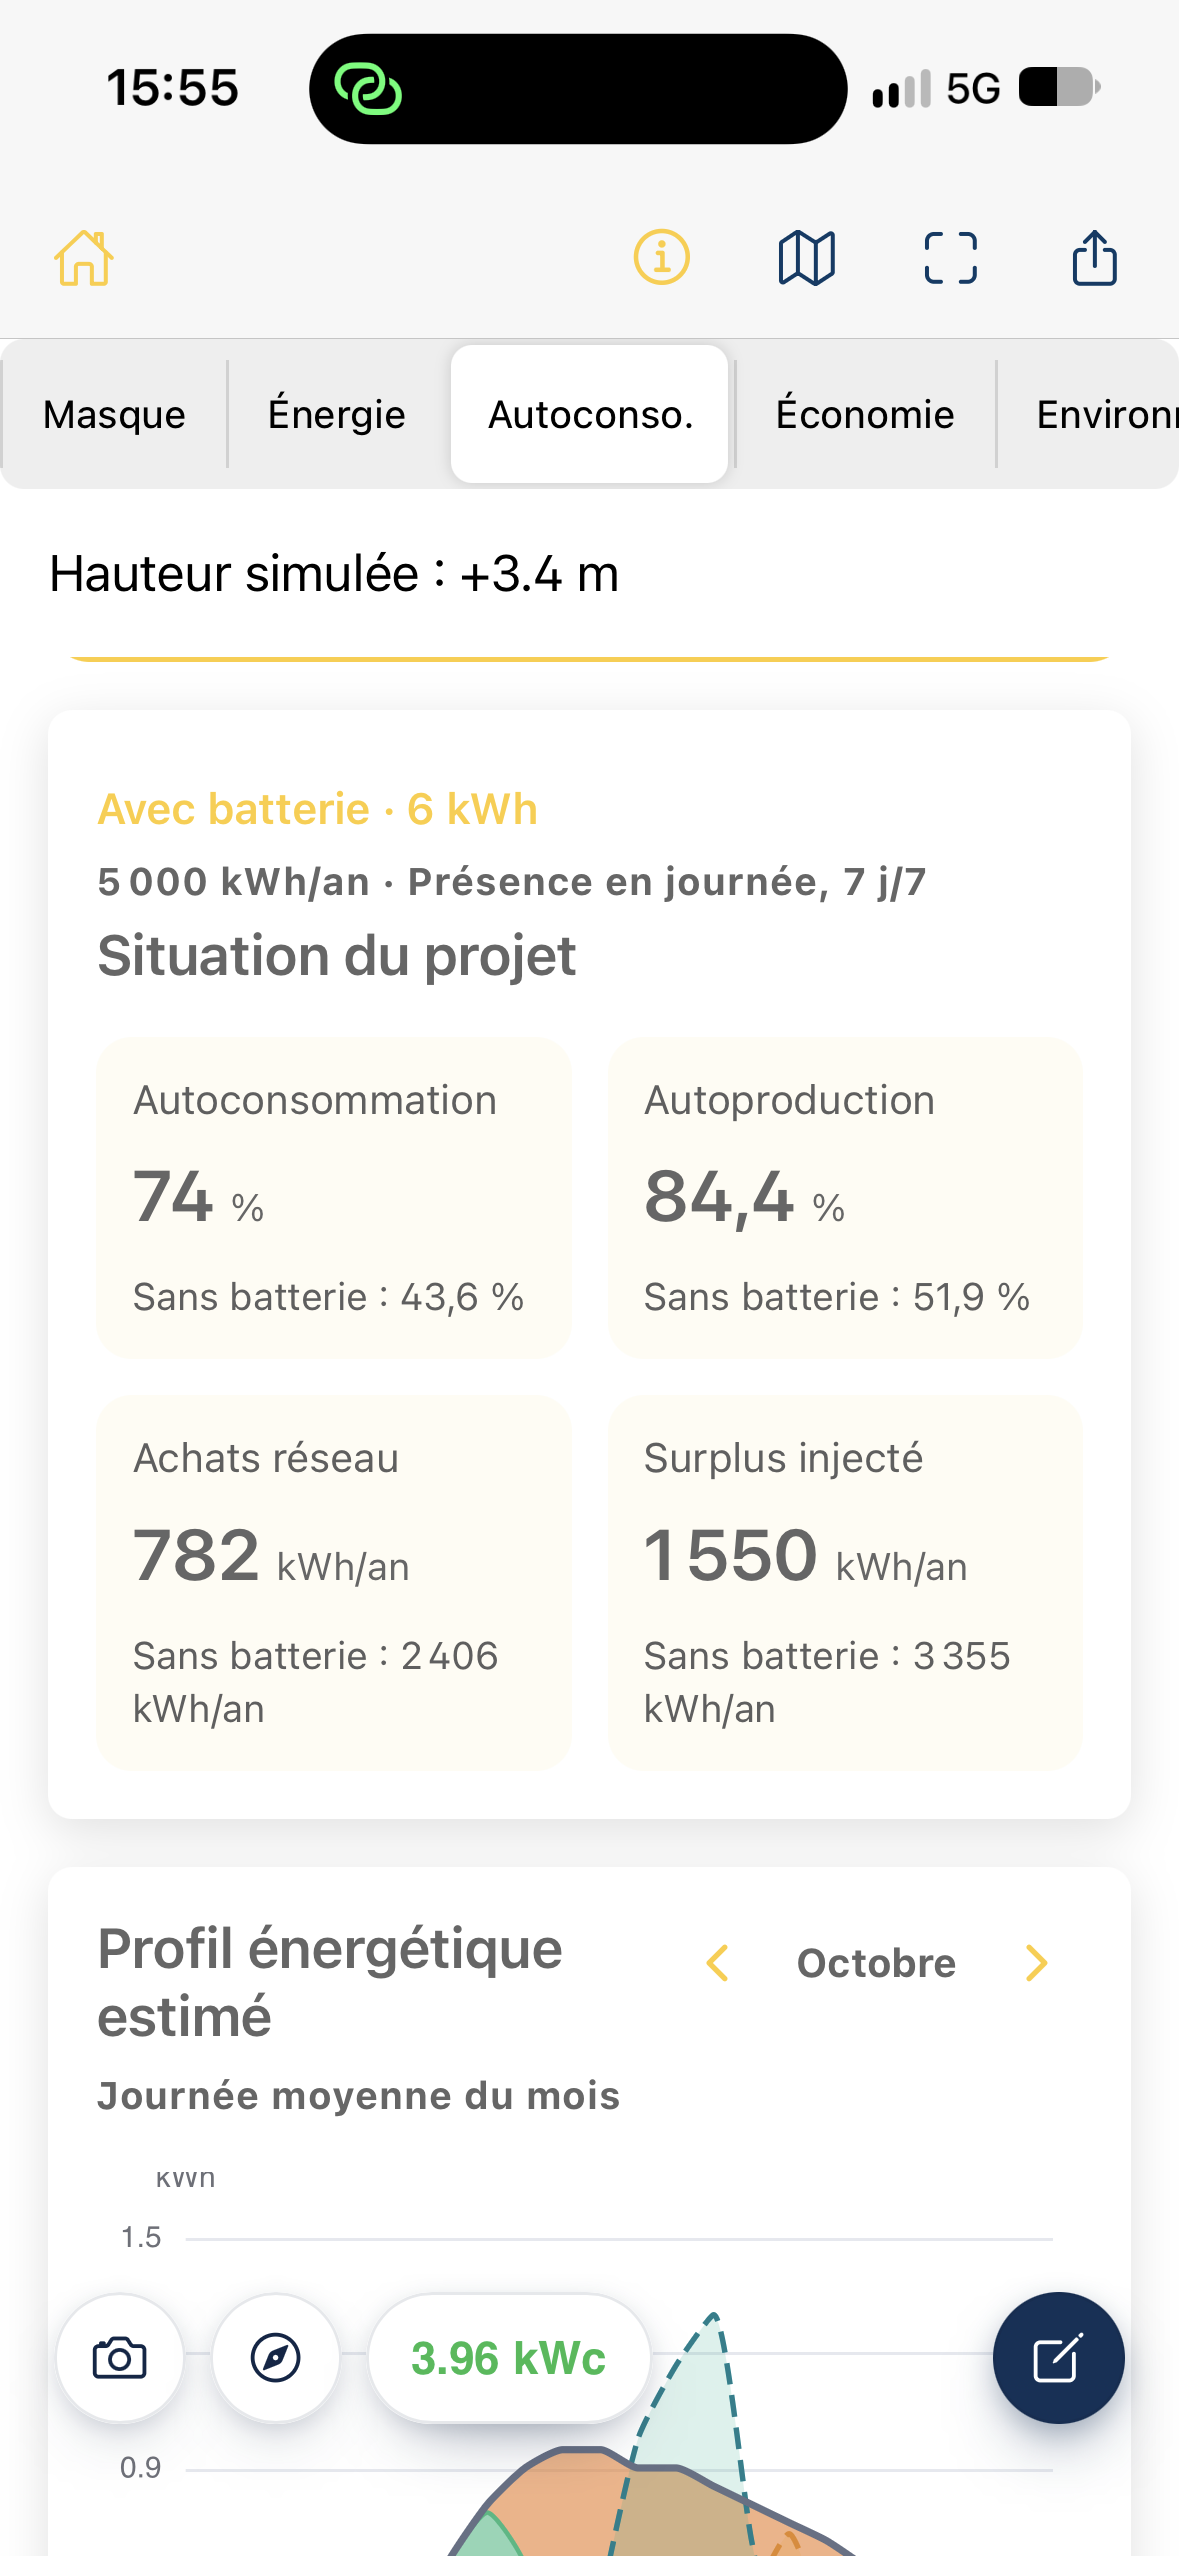
The top of the card shows annual consumption, the consumption profile and, where applicable, the selected battery capacity.
| Indicator | Interpretation |
|---|---|
| Self-consumption (%) | Share of panel production used on site, directly or through simulated storage. |
| Self-sufficiency (%) | Share of the site’s electricity consumption covered by the PV system, directly or through simulated storage. |
| Grid imports (kWh/year) | Electricity the site still needs to purchase from the grid over the year. |
| Exported surplus (kWh/year) | Estimated surplus PV production supplied to the grid. |
Screenshot example: with a 6 kWh battery, the app shows 74% self-consumption and 84.4% self-sufficiency, compared with 43.6% and 51.9% without a battery in this scenario. These rates use different denominators and should not be treated as equivalent.
A battery can therefore reduce grid imports and surplus exports without necessarily eliminating either.
Read the monthly energy profile
Section titled “Read the monthly energy profile”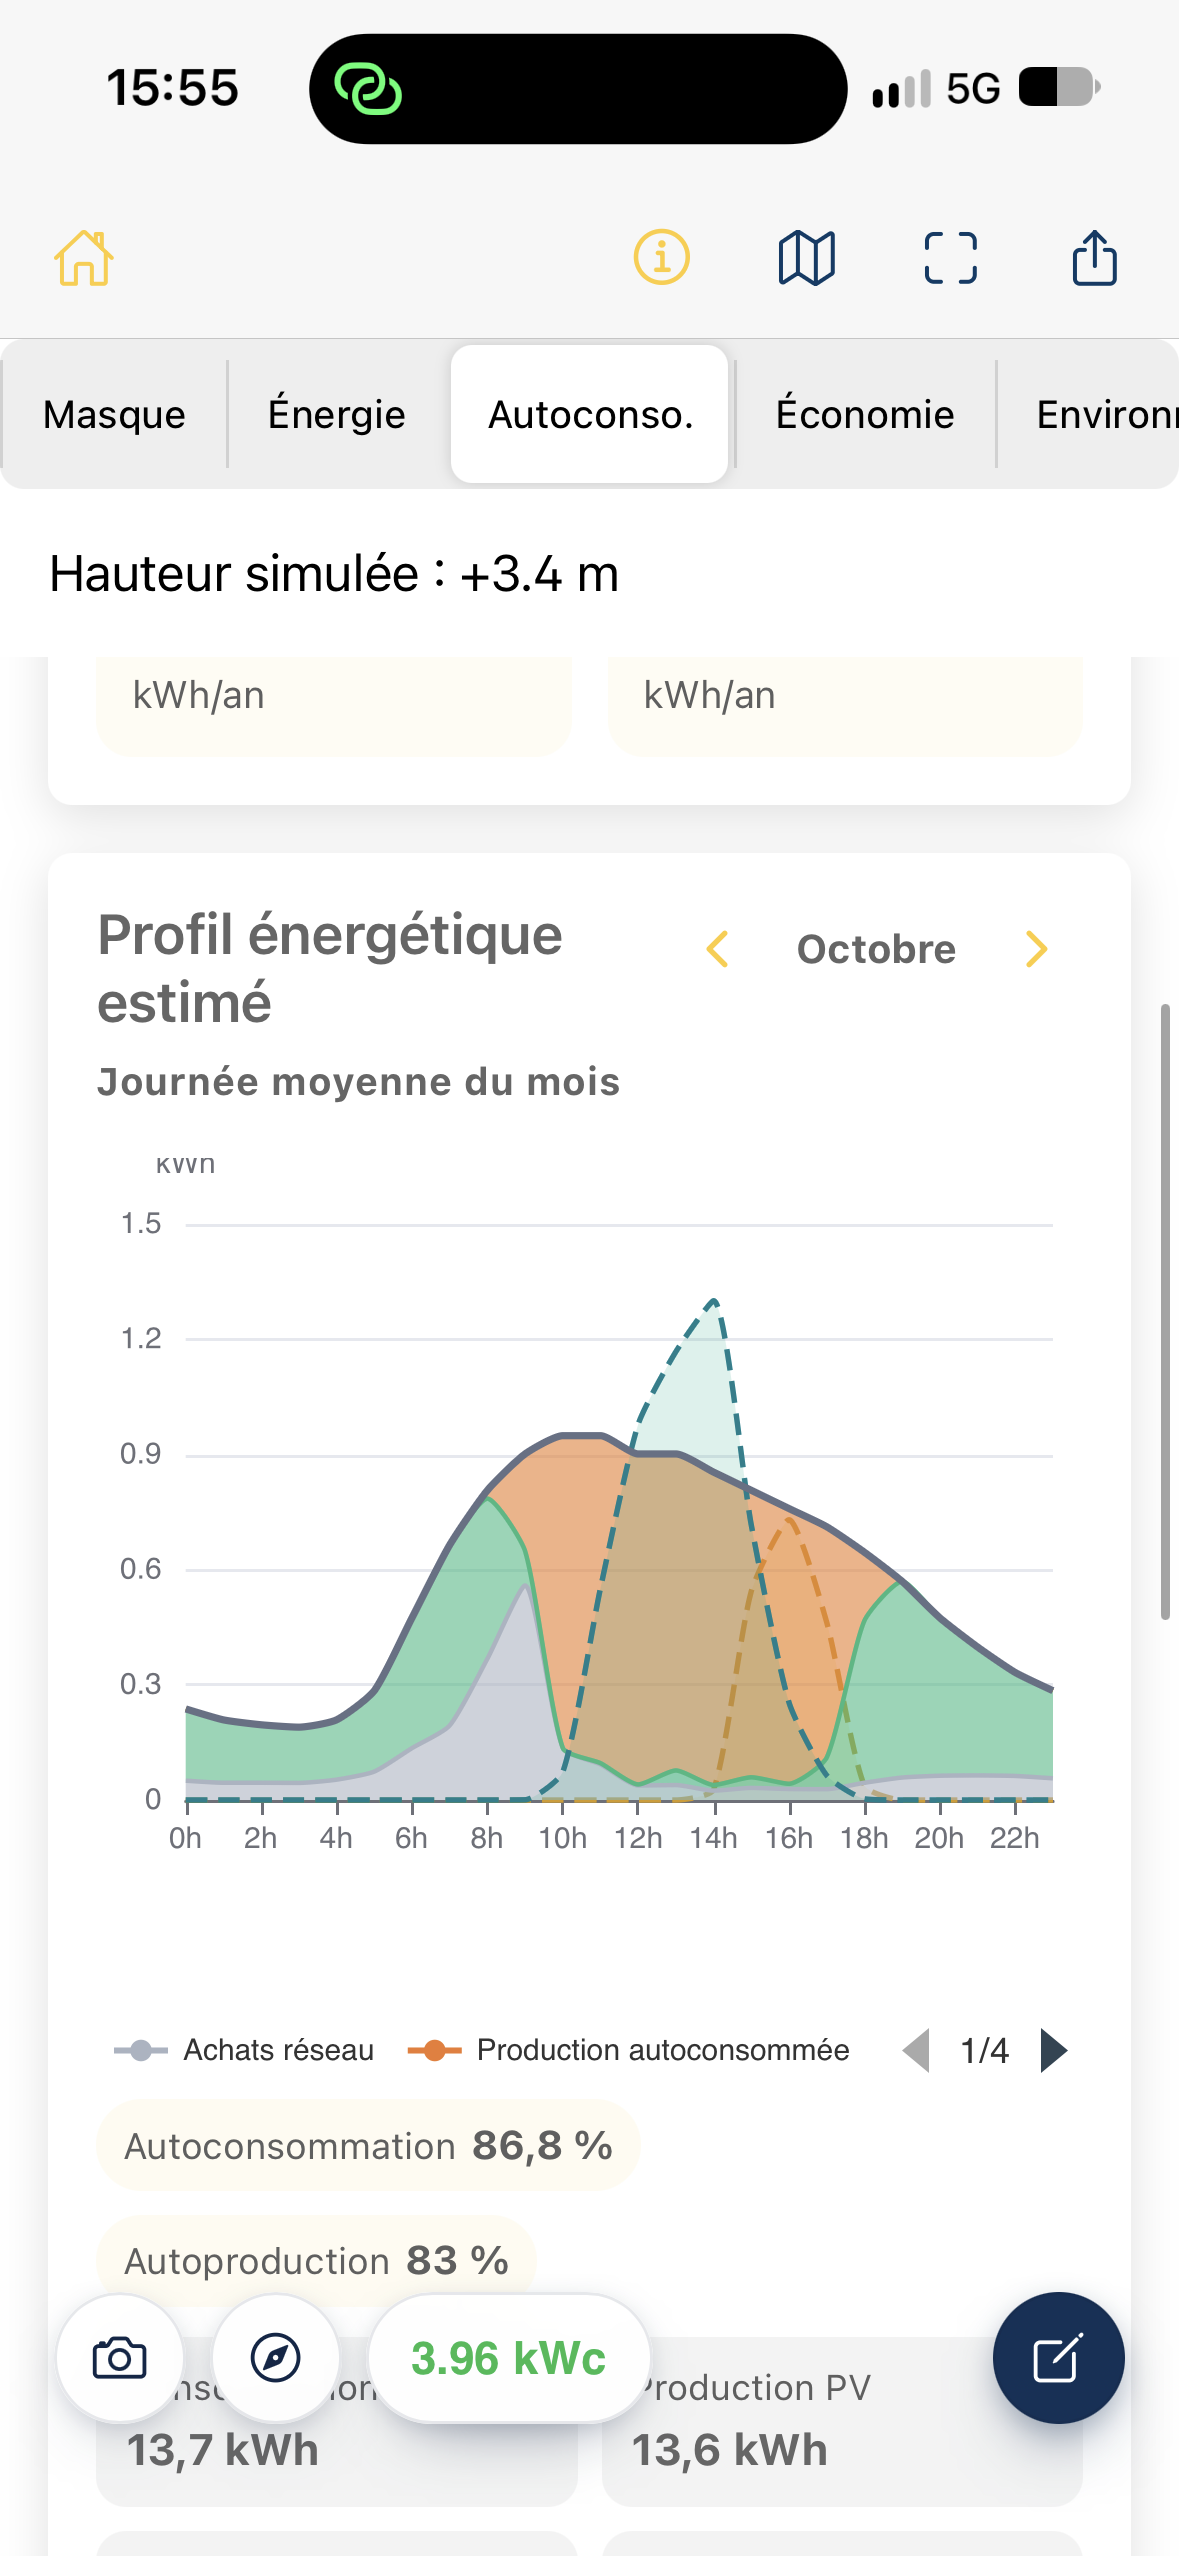
The Estimated energy profile chart shows an average day in the selected month, hour by hour. Use the arrows beside the month name to change the period.
Lines and shaded areas represent the scenario’s energy flows, including:
- consumption and PV production;
- PV production consumed on site;
- grid imports and exports;
- battery charging and discharging where applicable.
Use the legend to identify the displayed series. On mobile, legend navigation may let you browse several groups of series.
Below the chart are reference values for an average day of the month, including values in kWh. Rates shown here can differ from the annual summary because the aggregation period is different.
Understand the battery’s effect
Section titled “Understand the battery’s effect”When a battery is enabled, other sections may show additional energy that avoids grid purchases, estimated extra financial savings, installed cost and estimated simple payback.
These indicators concern adding the battery. They do not replace the profitability analysis for the complete PV project, available in Economy.
To change consumption, the profile or the battery, use Edit assumptions at the top of the tab.
Points to check
Section titled “Points to check”- A high self-consumption rate does not mean the site is self-sufficient: also review self-sufficiency and grid imports.
- The daily distribution depends on the chosen profile. Treat it as an estimate, especially for sites with unusual electricity usage patterns.
- The illustrated values are from an example project and do not indicate guaranteed savings.